Configuring Instruments
DS2 Docking Station
224
INDUSTRIAL SCIENTIFIC
Version 9.1 (P/N: 17112798)
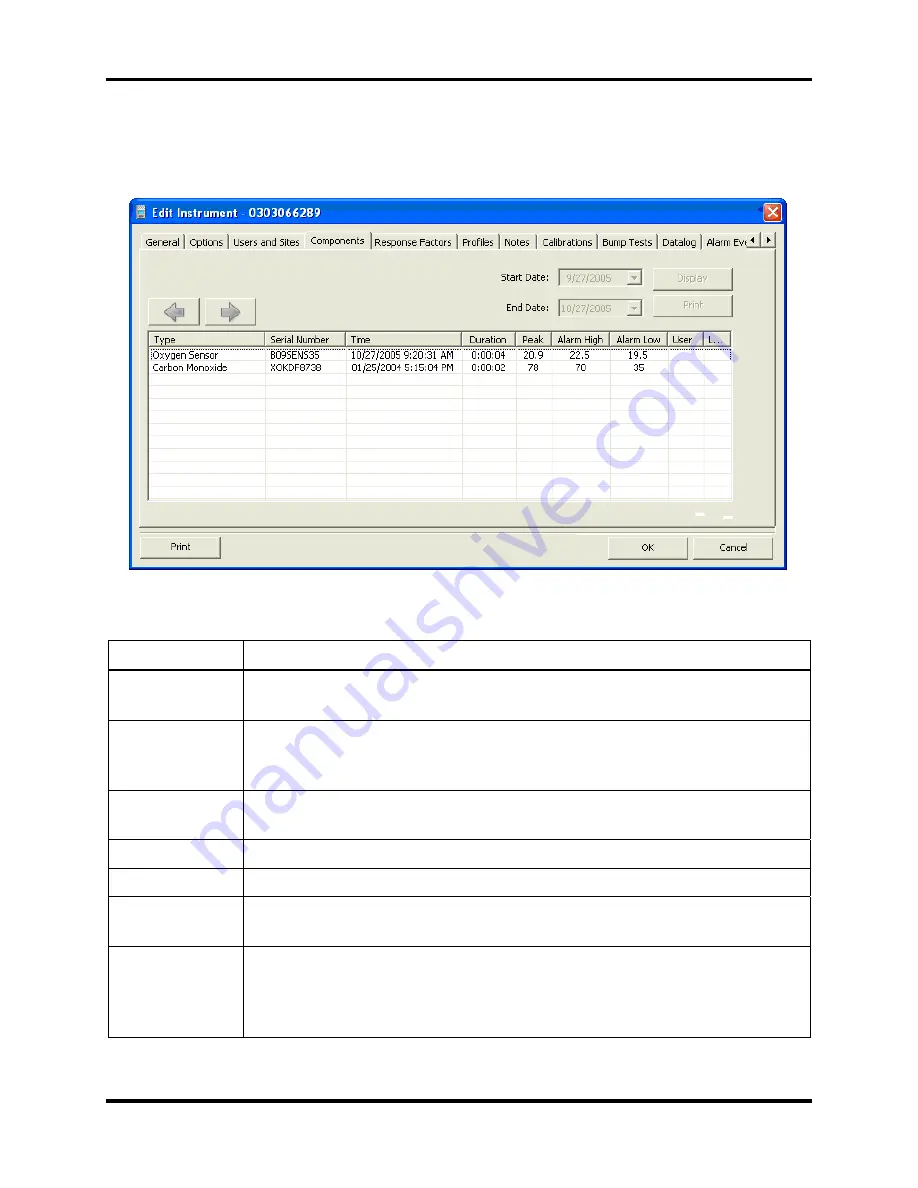
5.15. Edit Instrument – Alarm Events Tab
The Alarm Events tab displays alarm events downloaded from the instrument during a schedule
Alarm Events Download Event. The contents of the Alarm Events Tab are explained below.
Figure 5-42. Edit Instruments – Alarm Events Tab
Table 5-16. Components of the Alarm Events Tab of the Edit Instrument Screen
Component Description
Forward/Back
Arrow Buttons
The forward and back buttons are located on the left side of the screen
and allow the user to navigate through different alarm event screens.
Start Date and
End Date
These fields define selection criteria for session data. Select a Start Date
and an End Date, and then click the Display button to show alarm
information for the specified date range in the Session Window.
Display Button
Displays alarm data in the Session Window. To view only those sessions
within a selected date range, use the Start Date and End Date fields.
Print Button
Prints the current screen to the default printer.
OK Button
Displays specific alarm data for the sensor selected.
Cancel Button
Pressing the Cancel button returns the user to the Session selection screen
of the Alarm Events tab with no change to the data shown.
Alarm Events
Window
Scrollable window in which alarm data is displayed. Columns of the
Alarm Events Window include sensor type, serial number, the time the
alarm event was reported, the duration of the alarm event, and peak, high,
and low alarm values.


