2-18
IM 704510-01E
Summation display
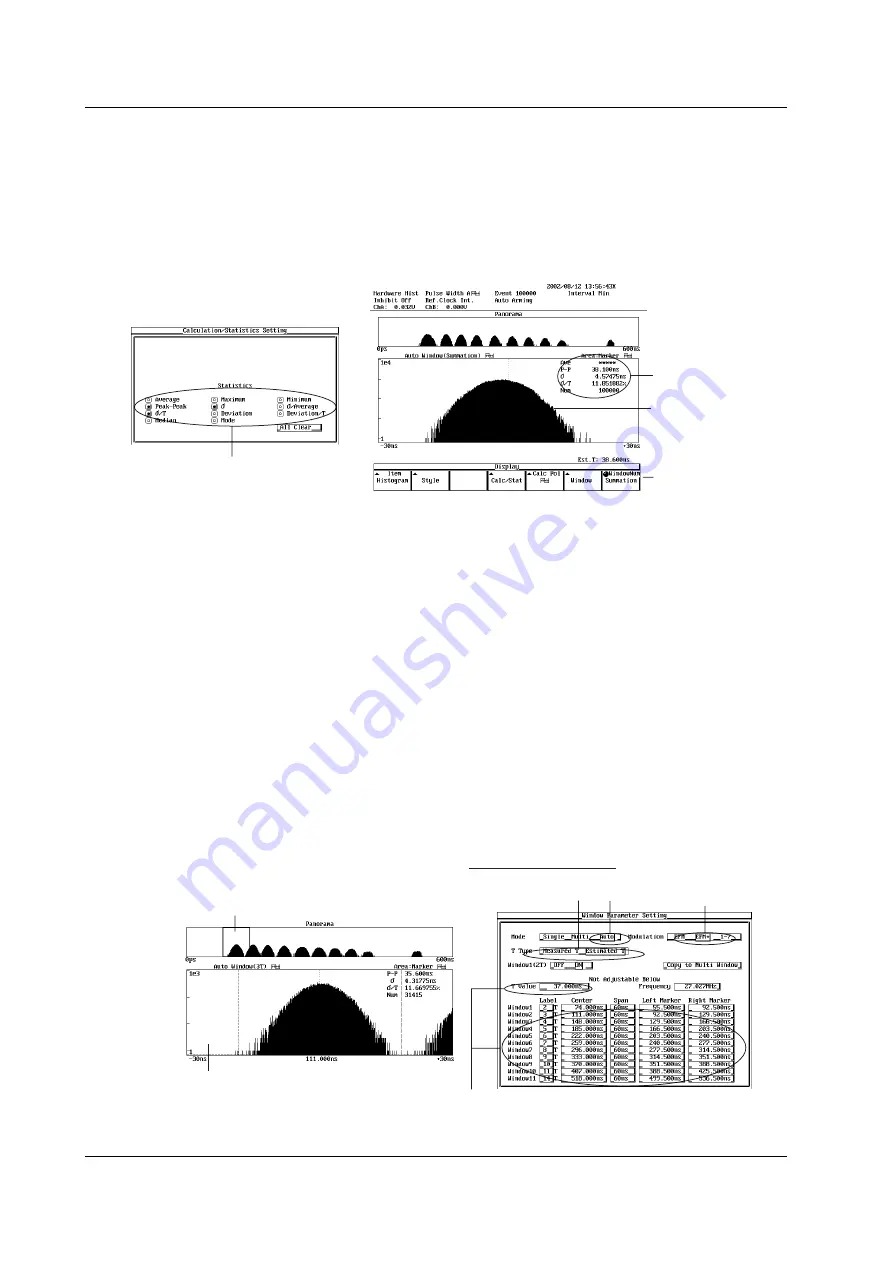
The histograms (enclosed by the X1 and X2 markers) of all windows that have been set
with the multi window function can be summed and displayed in one window. The center
values of the X-axis of the histogram of each window are aligned and the frequencies of
each bin are summed.
Only the histograms in the area enclosed by the markers are summed.
You can compare the data distribution between each histogram and calculate the
statistics of all histograms at once.
Statistical calculation performed
on the checked items
Statistical values of
the summed histogram
Histogram summing
all windows
Sum setting
Auto Window Function (see section 8.3 for the operating procedure)
This function automatically sets the window when the RLL (Run Length Limited) code is
set to the following modulation methods. The clock period T is measured, and the X-axis
values are automatically set.
The following modulation methods are supported.
• EFM modulation
• EFM+ modulation
• 1-7 modulation
There are two methods of automatic setting.
• Measured T: Apply the input signal to CH A and the read-out clock signal to CH B.
The value of T is measured from the period of the clock signal.
• Estimated T: The value of T is estimated from the average value of the input signal.
This method is used when the clock signal cannot be applied. The value
T is derived from the average value of each modulation method using
the following coefficients.
•
EFM modulation: Approx. 4.79T
•
EFM+ modulation: Approx. 4.72T
•
1-7 modulation:
Approx. 3.30T
Displays the 3T window on the main window
Window setup dialog box
Select the auto
measurement method
Auto window
Select the
modulation type
Automatically set the T value and the X-axis value
of each window
Main window
Summation Display
Like the multi window, summation display is also possible on the auto window.
2.6 Displaying the Measured/Calculated Results


