Chapter 5
EDGE Asynchronous Mode Operation
Alignment
4460 GSM System Option and 4468 EDGE System Option
Version 12.20
193
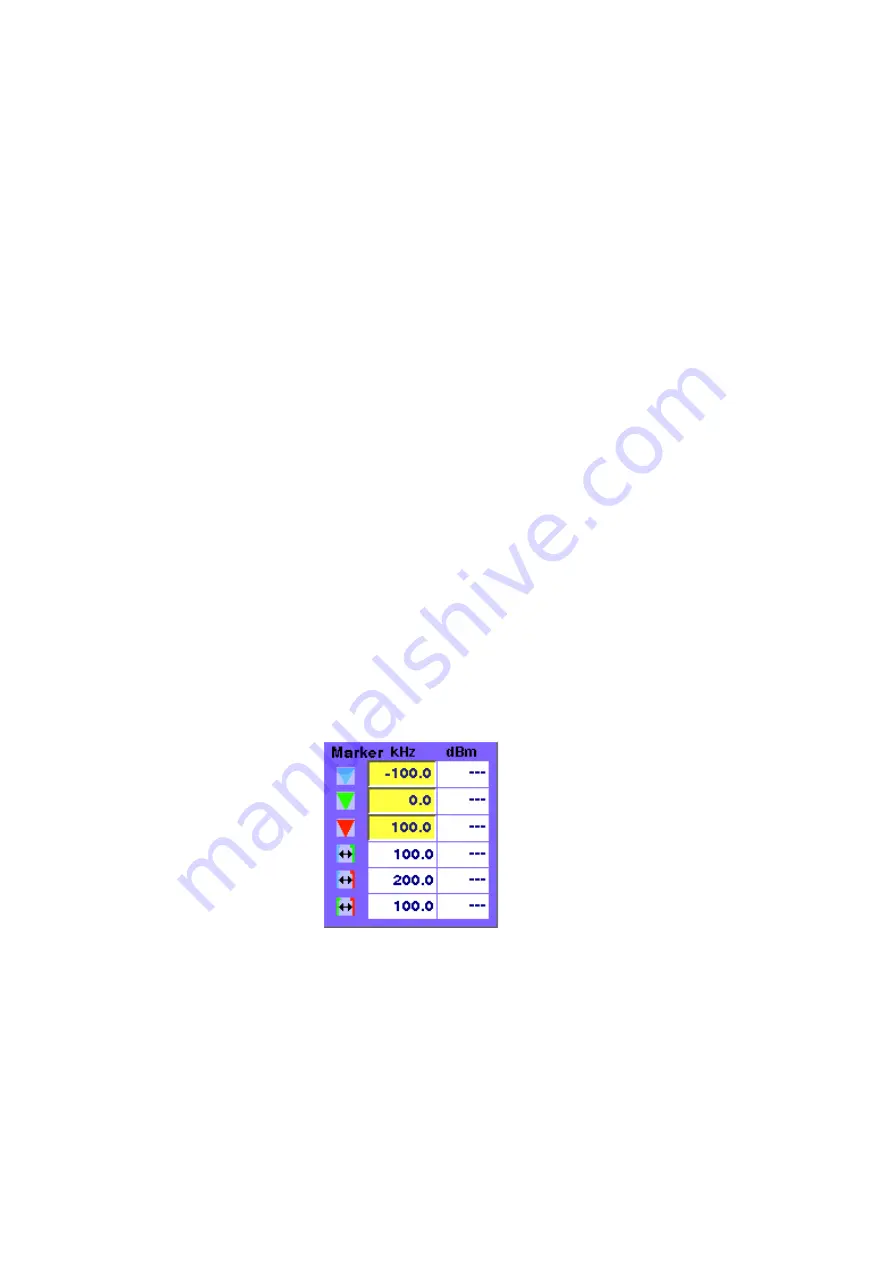
– The spectrum display contains three markers; the marker section in the
lower left part of the screen allows you to adjust their respective horizontal
positions and to read the results.
– The lower right section allows you to select the type of mobile phone to be
tested and to choose a test step. It also displays the most important RF
settings and shows the measured RF power.
Selecting a mobile phone and
test step
Two scroll fields allow you to select the type of mobile phone under test and the
next test step for the selected phone, respectively.
Type —
This scroll field allows you to select a mobile phone. The 4400 is deliv-
ered with a few examples; scripts for more mobile phones may be available from
the mobile phone manufacturers, from Willtek’s support team or from Willtek’s
web pages.
Step —
For each selectable mobile phone, a number of test steps are available.
A new step can be selected by its name from the Step scroll box. In each new
step, generator and analyzer settings may change as well as the type of measure-
ment. The most important generator (Gen) and analyzer (Ana) settings are shown
below the Step scroll box.
Instead of selecting a step with the scroll box, you can select a new step with the
softkeys (see below).
Results and Markers
The
Spectrum
display can show you the spectrum within 100 kHz around the
center frequency. The result is displayed relative to the peak; this means that the
highest point in the frequency spectrum is always 0 dB.
The center channel and frequency are indicated below the selection fields for
phone type and test step (Ana TCH, Freq). The spectrum is measured in a 10 kHz
resolution bandwidth.
Three markers are available, allowing you to read the numerical results as abso-
lute values and relative to each other.
Many tests require a reading of the
RF power
. The RF power (burst peak power)
is shown on the right-hand side, measured in dBm.
A measurement counter indicates how many measurements have been
performed and displayed already since the start of the test. This can be useful in
order to verify that measurements are still being performed. It can also be used


