Instruction manual
NivuSonic Clamp on
®
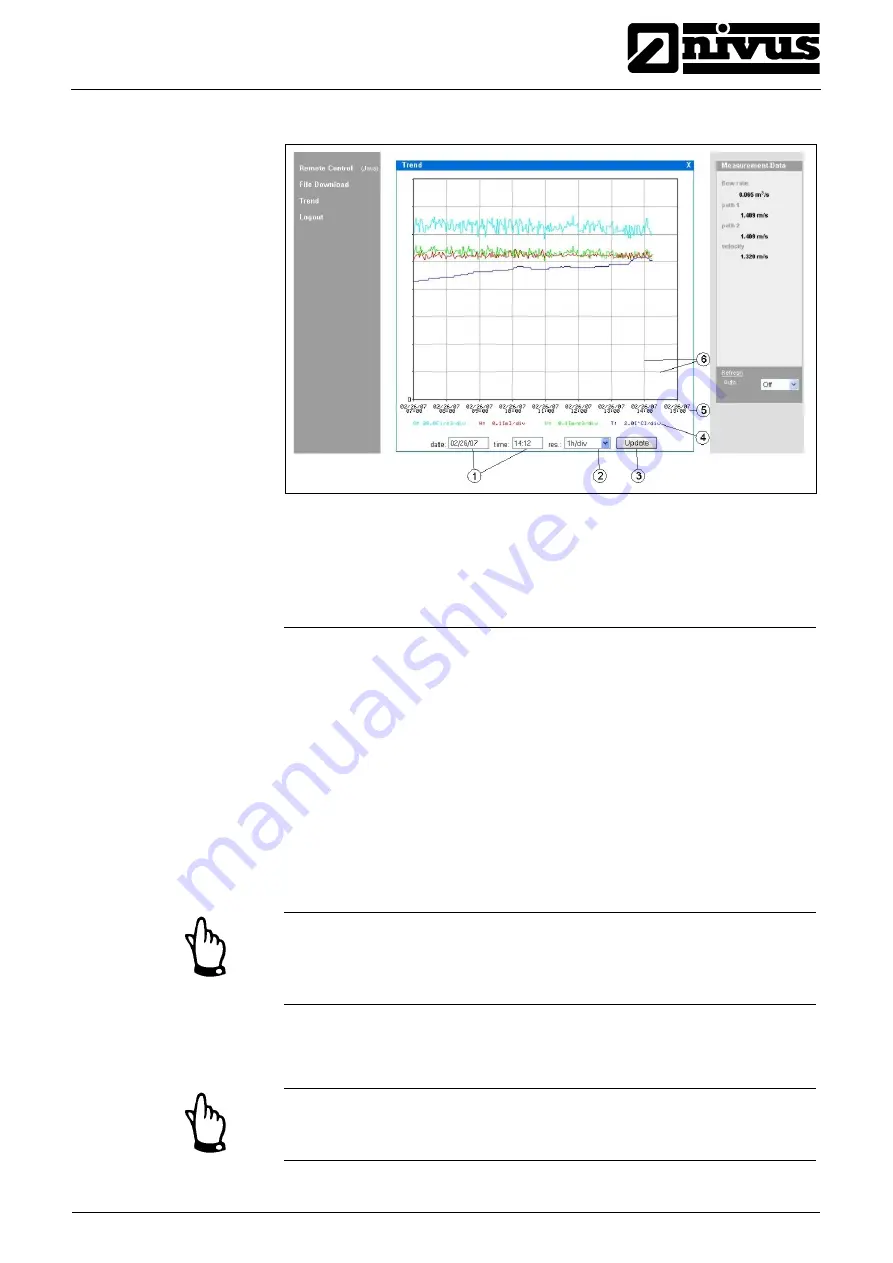
The screen below comes up after clicking:
1 Display
range
2 Resolution (time scale)
3 Update
button
4 Scale of readings
5 Time
axis
6 Scale
grid
Fig. 6-33
Online trend graph
Flow volume, fill level, average flow velocity and medium temperature are going
to be indicated as coloured progress lines. The units here are equal to the units
indicated on the NivuSonic CO display (see chapter 8.4)
The readings on the y-axis are going to be scaled according to a grid in steps of
0,1; 0,2; 0,5; 1; 2; 5; 10 ..... up to a maximum of 10000. Here the selected scale
unit is equal to a horizontal grid line (see point 6 in Fig. 6-33). Set the start point
for the trend graph to be indicated under point 1. The resolution (scale of the
time axis) can be set under point 2. Select here between 10 minutes, 1 hour, 6
hours or 24 hours/grid line.
A click on the >Update< button (point 3 in Fig. 6-33) will refresh the screen by
the new measurement data which have been collected whilst watching.
If the selected start date/time of the trend is the current date/time or if the time
axis range allows to view a greater range than selected by start date/time and
resolution this will cause the screen to indicate older values than selected
additionally.
Log out the on-site unit by using the >Logout< button located on the left-hand
side of the screen as well. This will take you back to the NIVUS homepage.
If no data transmission has been executed for 5 minutes, the Nivu-
Sonic CO will automatically interrupt the connection in order to avoid unnec-
essary expenses.
NivuSonic CO - Rev. 00 as of 08.12.2010
Page 41
Summary of Contents for NivuSonic Clamp On
Page 109: ...18 Declaration of Conformity...
Page 110: ......


