Using the Report Wizard
CentreVu Report Designer Version 8 User Guide
Creating a New Report
2-24
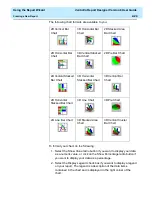
The following chart formats are available to you:
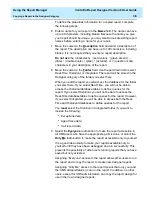
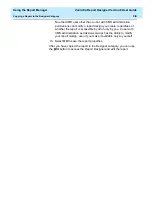
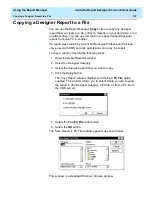
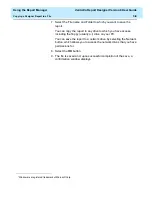
To format your chart, do the following:
1. Select the Show Value radio button if you want to display your data
as a numeric value, or click on the Show Percentage radio button if
you want to display your data as a percentage.
2. Select the Display Legend check box if you want to display a legend
on your report. The legend is a description of the data items
contained in the chart and is displayed in the right corner of the
chart.
2D Vertical Bar
Chart
3D Horizontal Bar
Chart
2D Stacked Area
Bar Chart
2D Horizontal Bar
Chart
3D Vertical Stacked
Bar Chart
2D Pie Bar Chart
2D Vertical Stacked
Bar Chart
3D Horizontal
Stacked Bar Chart
3D Vertical Bar
Chart
2D Horizontal
Stacked Bar Chart
3D Line Chart
3D Pie Chart
2D Line Bar Chart
3D Stacked Area
Chart
3D Vertical Cluster
Bar Chart
Summary of Contents for CentreVu Report Designer
Page 4: ......
Page 18: ...Introduction CentreVu Report Designer Version 8 User Guide Related Documents 1 8...
Page 102: ...Edit Inputs CentreVu Report Designer Version 8 User Guide Viewing the Input Window 6 16...
Page 198: ...Format Text CentreVu Report Designer Version 8 User Guide Formatting Text on the Report 15 4...
Page 264: ...Index CentreVu CMS R3V8 Upgrades and Migration IN 10...
Page 266: ......


