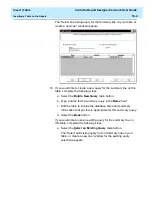
Insert | Chart
CentreVu Report Designer Version 8 User Guide
Inserting a Chart on a Report
8-3
If you are creating a chart that will use categories and series as
controls on the axis, you need to verify that the first item listed on the
Data on Chart box is the item that you want to use as the series for
the chart.
4. Select the Next button.
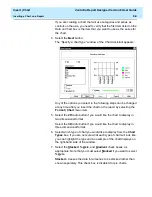
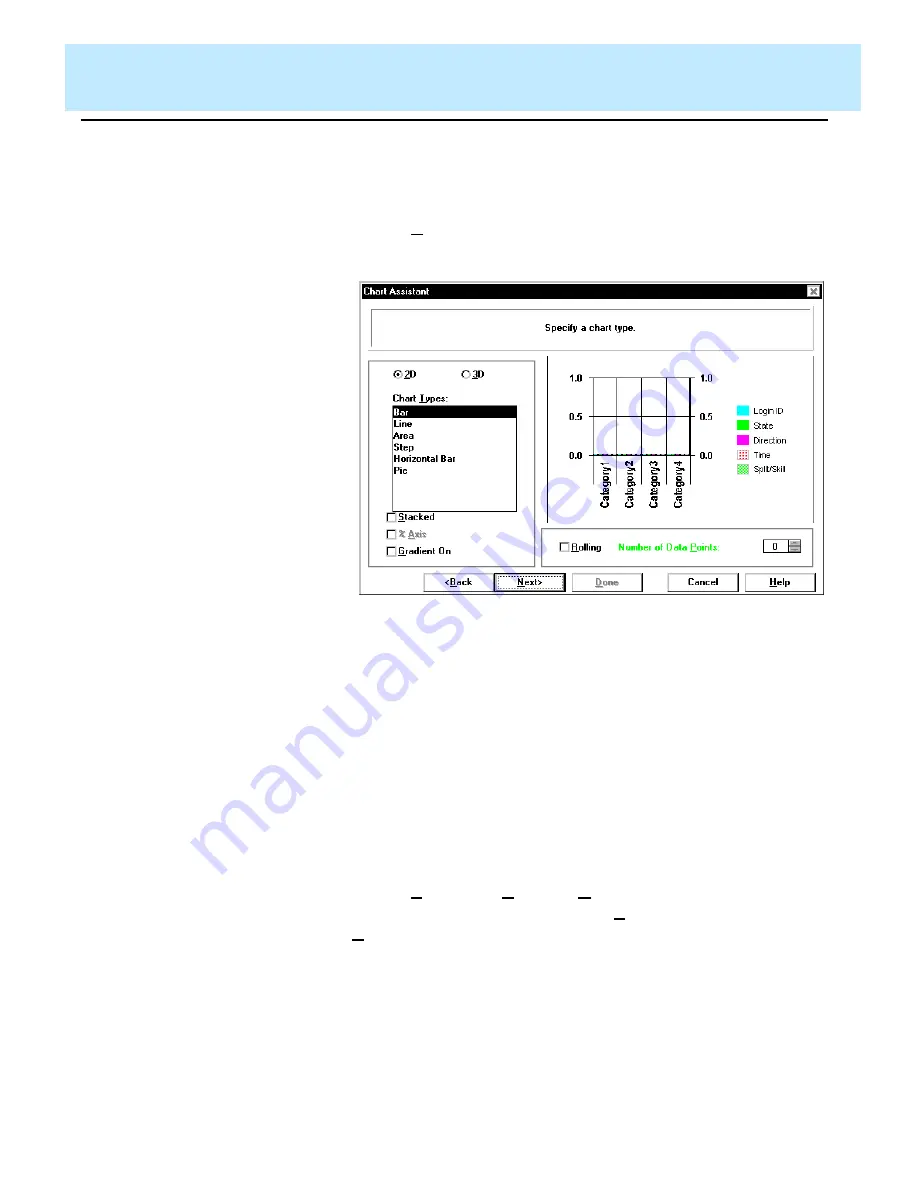
The “Specify a chart type” window of the Chart Assistant appears:
Any of the options you select in the following steps can be changed
at any time after you insert the chart on the report by selecting the
Format | Chart menu item.
5. Select the 2D radio button if you would like the chart to display in
two dimensional format.
Select the 3D radio button if you would like the chart to display in
three dimensional format.
6. Select which type of chart you would like to display from the Chart
Types box. If you are not sure what each type of chart will look like,
you can highlight the type and an example of the chart displays on
the right-hand side of the window.
7. Select the Stacked, % Axis, and Gradient check boxes, as
appropriate. Note that you must select Stacked if you want to select
% Axis.
Stacked - Causes the data for all series to be stacked rather than
shown separately. This check box is disabled for pie charts.
Summary of Contents for CentreVu Report Designer
Page 4: ......
Page 18: ...Introduction CentreVu Report Designer Version 8 User Guide Related Documents 1 8...
Page 102: ...Edit Inputs CentreVu Report Designer Version 8 User Guide Viewing the Input Window 6 16...
Page 198: ...Format Text CentreVu Report Designer Version 8 User Guide Formatting Text on the Report 15 4...
Page 264: ...Index CentreVu CMS R3V8 Upgrades and Migration IN 10...
Page 266: ......

