Using the Report Designer - Examples
CentreVu Report Designer Version 8 User Guide
General Information
A-4
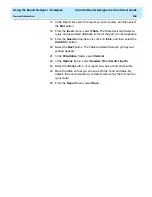
17. In the Report list, select the report you just created, and then select
the Edit button.
18. From the Insert menu, select Table. The Table Assistant (Select a
query and associated database items for the grid.) window appears.
19. From the Queries drop-down list, click on table, and then select the
Add All>> button.
20. Select the Next button. The Table Assistant (Select a grid layout.)
window appears.
21. In the Orientation frame, select Vertical.
22. In the Options frame, select Headers On and Grid Line On.
23. Select the Done button. Your report now has a chart and a table.
24. Move the table so that you can see both the chart and table. By
default, the second section (your table) will overlay the first section
(your chart).
25. From the Report menu, select Save.
Summary of Contents for CentreVu Report Designer
Page 4: ......
Page 18: ...Introduction CentreVu Report Designer Version 8 User Guide Related Documents 1 8...
Page 102: ...Edit Inputs CentreVu Report Designer Version 8 User Guide Viewing the Input Window 6 16...
Page 198: ...Format Text CentreVu Report Designer Version 8 User Guide Formatting Text on the Report 15 4...
Page 264: ...Index CentreVu CMS R3V8 Upgrades and Migration IN 10...
Page 266: ......

