SDA Operator’s Manual
Bit Error Rate and Jitter
Equation 1 shows that the total jitter is a function of bit error rate. This relationship is based on the
effect that jitter has on the bit error rate of a system. The bit error rate is influenced by other
parameters of the system, such as noise, so it is not correct to say that BER and jitter are
equivalent. It is the contribution to the overall bit error rate caused by jitter that is shown in
Equation 1. A bit error will occur when the data signal transitions from one state to another during
the setup and hold time, as shown in Figure 6. Since jitter has a random component, the location
in time of the transitions varies over a range of values. The longer the transitions are observed,
the greater this range will be. Now, if we think of each transition in the data signal as the change
in a bit value, then a transition at the wrong time (i.e., outside the setup and hold window) will
lead to a bit error. The probability of this event is equivalent to the bit error rate contribution due to
jitter. The total jitter gives a confidence interval for the jitter in that it will not exceed a certain
value to a confidence of (1-BER). The term “bit error rate” is commonly used in this context to
refer to the jitter confidence interval in many specifications.
EyeBER differs from BER in that eyeBER is calculated from Q-factor and is, therefore, based on
signal-to-noise ratio; BER, on the other hand, is based on jitter.
Total Jitter
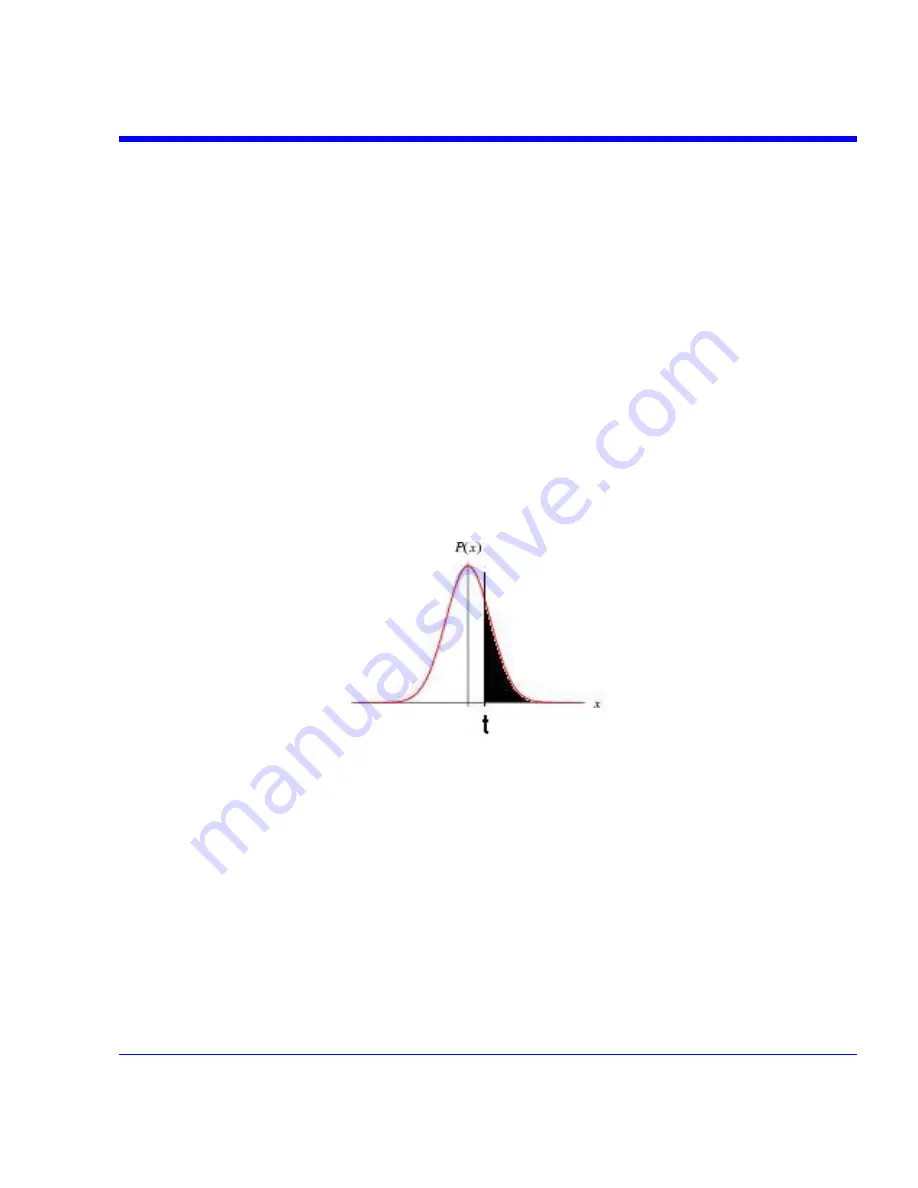
Figure 8. Probability of a data edge displacement greater than time t from the sampling clock. The
mean value of the distribution is 0 which represents perfect alignment.
The total jitter is the peak-to-peak jitter in a clock or data signal within a specified confidence,
equal to 1-BER. An example of a normally distributed jitter PDF is shown in Figure 8. In order to
determine the total jitter from the PDF, the probability of the jitter exceeding a certain value
t
must
be evaluated. This is done by integrating the PDF from a time
t
to +
∞
which will give the total
probability of an edge occurring at or after this time. The probability can be computed for all
values of
t
by integrating the PDF separately for
t
> 0 and
t
< 0. The resulting curve, shown in
SDA-OM-E Rev H
375
Summary of Contents for SDA
Page 1: ...SERIAL DATA ANALYZER OPERATOR S MANUAL December 2007 ...
Page 223: ...SDA Operator s Manual Example 6 SDA OM E Rev H 223 ...
Page 225: ...SDA Operator s Manual SDA OM E Rev H 225 ...
Page 246: ...246 SDA OM E Rev H ...
Page 247: ...SDA Operator s Manual Excel Example 5 Using a Surface Plot SDA OM E Rev H 247 ...
Page 279: ...SDA Operator s Manual Convolving two signals SDA OM E Rev H 279 ...
Page 310: ...The jitter wizard is accessed from the Analysis drop down menu 310 SDA OM E Rev H ...
Page 327: ...SDA Operator s Manual SDA OM E Rev H 327 ...
Page 328: ...328 SDA OM E Rev H ...
Page 394: ...394 SDA OM E Rev H ...


