You can select a saturation level as a percentage of the maximum population. All populations
above the saturation population are then assigned the highest color intensity: that is, they are
saturated. At the same time, all populations below the saturation level are assigned the remaining
intensities. Data populations are dynamically updated as data from new acquisitions is
accumulated.
Color mode persistence, selected by touching
, works on the same principle as the Analog
persistence feature, but instead uses the entire color spectrum to map signal intensity: violet for
minimum population, red for maximum population. A saturation level of 100% spreads the
intensity variation across the entire distribution; at lower saturation levels the intensity will
saturate (become the brightest color) at the percentage value specified. Lowering this percentage
causes the pixels to be saturated at a lower population, and makes visible those rarely hit pixels
not seen at higher percentages.
3-Dimensional Persistence
By selecting
3d
, you can create a topographical view of your waveform from a selection
of shadings, textures, and hues. The advantage of the topographical view is that areas of highest
and lowest intensity are shown as peaks and valleys, in addition to color or brightness. The shape
of the peaks (pointed or flat) can reveal further information about the frequency of occurrences in
your waveform.
The instrument also gives you the ability to turn the X and Y axes of the waveform through 180°
of rotation from -90° to +90°.
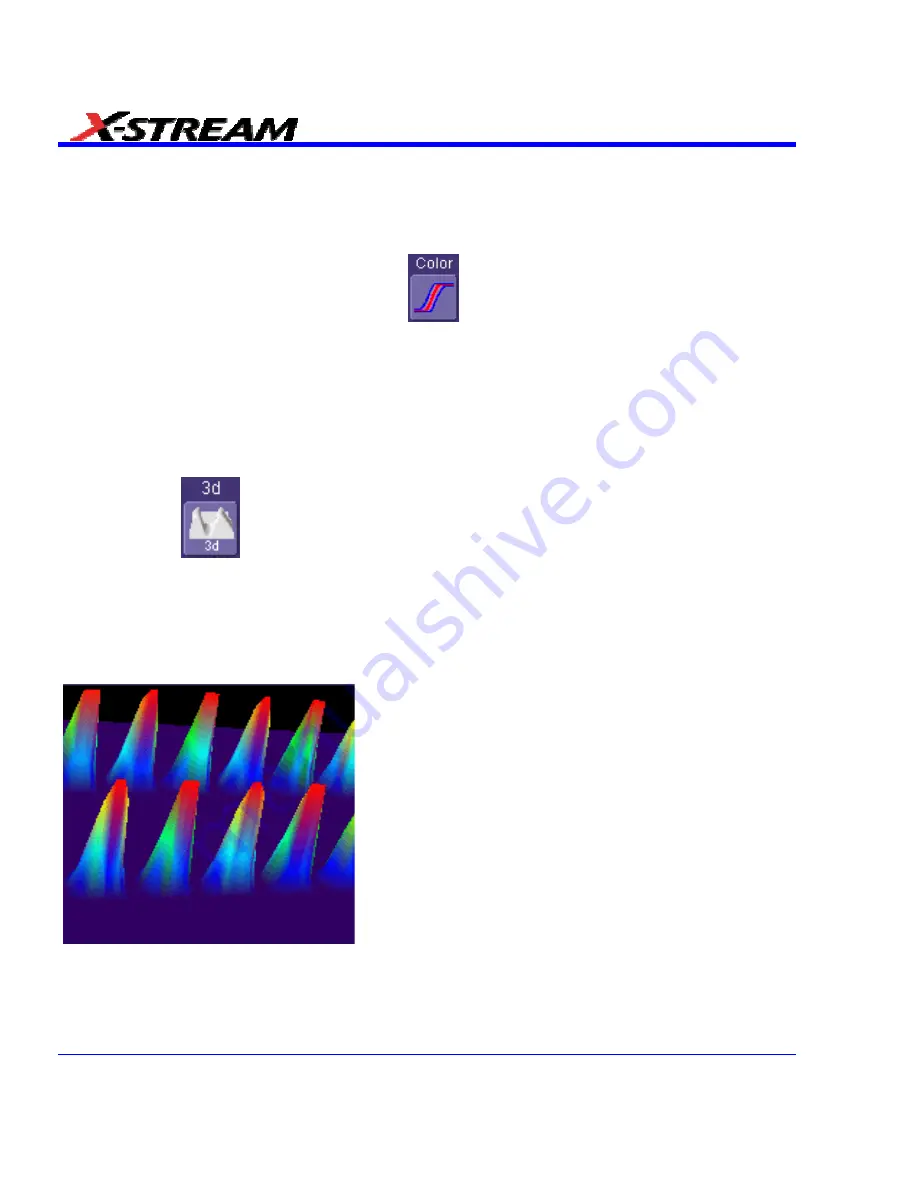
Here is an example of a 3-dimensional view of a square
wave using the
solid
view of color-graded persistence.
Saturation is set at 50%, with red areas indicating highest
intensity. The X-axis has been rotated 60%; the Y-axis
has been rotated 15%.
98
SDA-OM-E Rev H
Summary of Contents for SDA
Page 1: ...SERIAL DATA ANALYZER OPERATOR S MANUAL December 2007 ...
Page 223: ...SDA Operator s Manual Example 6 SDA OM E Rev H 223 ...
Page 225: ...SDA Operator s Manual SDA OM E Rev H 225 ...
Page 246: ...246 SDA OM E Rev H ...
Page 247: ...SDA Operator s Manual Excel Example 5 Using a Surface Plot SDA OM E Rev H 247 ...
Page 279: ...SDA Operator s Manual Convolving two signals SDA OM E Rev H 279 ...
Page 310: ...The jitter wizard is accessed from the Analysis drop down menu 310 SDA OM E Rev H ...
Page 327: ...SDA Operator s Manual SDA OM E Rev H 327 ...
Page 328: ...328 SDA OM E Rev H ...
Page 394: ...394 SDA OM E Rev H ...


