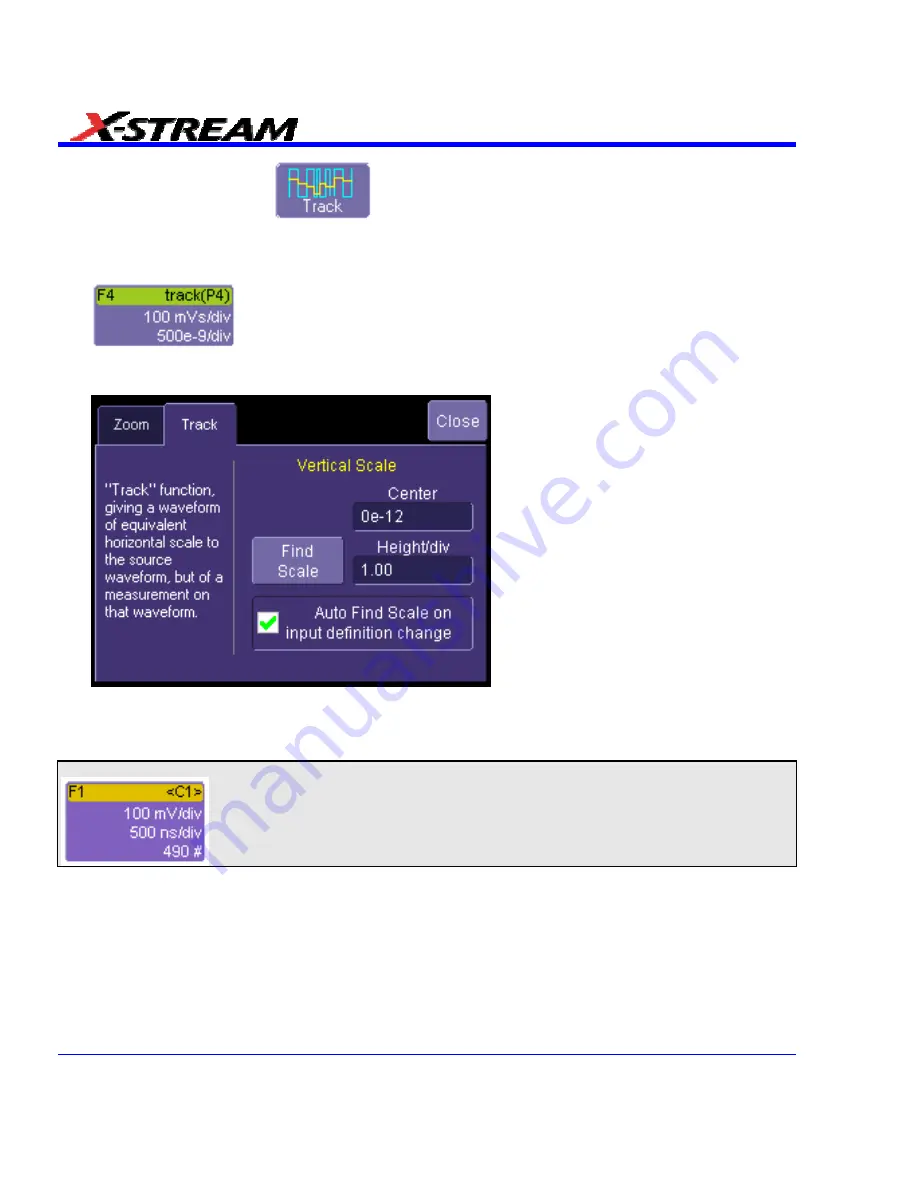
5. Touch
the
Track
button
at the bottom of the dialog; then, from the
Math
selection for Track
menu, select a math function location (F1 to Fx The number of math
traces available depends on the software options loaded on your scope. See specifications.)
to store the Track display. The Track will be displayed along with the trace label
Example Track Trace Label for the math function you selected.
6. Touch the newly displayed Track math function trace label if you want to change any settings
in the Track dialog:
HISTOGRAMS
Creating and Viewing a Histogram
Note:
The number of sweeps comprising the histogram will be displayed in the bottom line of the trace descriptor label:
Single Parameter Histogram Setup
From Measure Dialog
1. In the menu bar, touch
Measure
, then
Measure Setup
.
2. Touch
the
My Measure
button.
3. Touch one of tabs
P1
through
Px
.
4. Touch
inside
the
Source1
field and select an input waveform from the pop-up menu.
5. Touch
inside
the
Measure
field and select a parameter from the pop-up menu.
116
SDA-OM-E Rev H
Summary of Contents for SDA
Page 1: ...SERIAL DATA ANALYZER OPERATOR S MANUAL December 2007 ...
Page 223: ...SDA Operator s Manual Example 6 SDA OM E Rev H 223 ...
Page 225: ...SDA Operator s Manual SDA OM E Rev H 225 ...
Page 246: ...246 SDA OM E Rev H ...
Page 247: ...SDA Operator s Manual Excel Example 5 Using a Surface Plot SDA OM E Rev H 247 ...
Page 279: ...SDA Operator s Manual Convolving two signals SDA OM E Rev H 279 ...
Page 310: ...The jitter wizard is accessed from the Analysis drop down menu 310 SDA OM E Rev H ...
Page 327: ...SDA Operator s Manual SDA OM E Rev H 327 ...
Page 328: ...328 SDA OM E Rev H ...
Page 394: ...394 SDA OM E Rev H ...


