Chapter 1: Basics
39
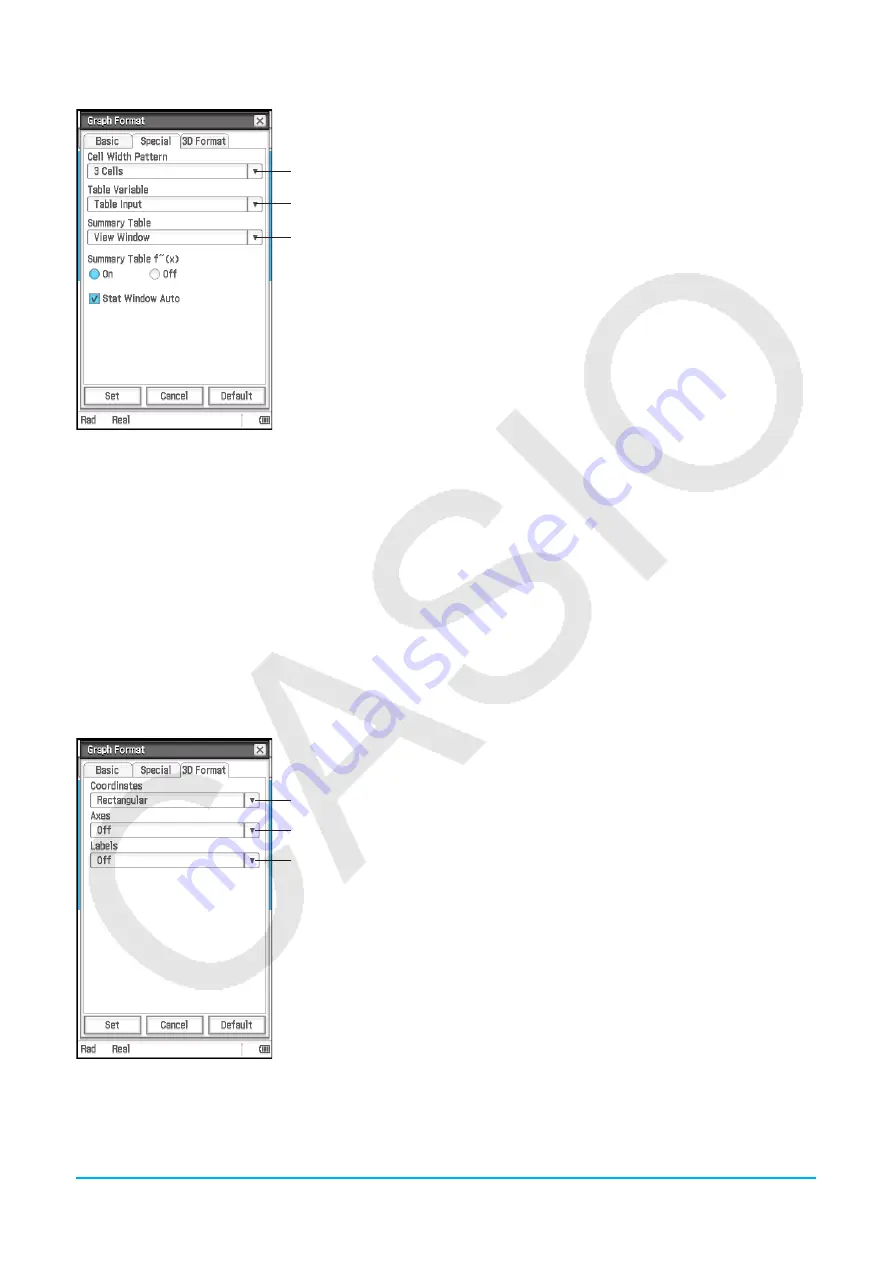
[Special] tab
1
2
3
To specify the row width for Stat Editor and data table displays
Tap
1
and then select a cell width pattern: 2 Cells, 3 Cells*, or 4 Cells for
vertical display orientation, or 4 Cells, 5 Cells*, or 6 Cells for horizontal
orientation (see “Changing the Display Orientation” on page 16).
To specify a source for table data
Tap
2
and then tap one of the settings described below.
Table Input*: Uses the data input in a Table Input dialog box as the source
for number table generation.
list1 through list6: Uses list data in list1 through list6 as the source for
number table generation.
<list name>: Uses the list data in a selected list as the source for number
table generation.
For details about how to generate a number table using each setting, see
“Generating a Number Table” (page 108).
To specify a source for summary table data
Tap
3
and then tap one of the settings described below.
View Window*: Uses View Window settings as the source for summary table generation.
list1 through list6: Uses list data in list1 through list6 as the source for summary table generation.
<list name>: Uses the list data in a selected list as the source for summary table generation.
For details about how to generate a summary table using each setting, see “Generating a Summary Table”
(page 110).
To show or hide the second derivative for summary tables
Select the On button* under “Summary Table
f
(
x
)” to show the second derivative, or the Off button to hide it.
To specify auto setting or manual setting of Statistics application View Window settings
Select the “Stat Window Auto” check box* to specify automatic setting configuration, or clear the check box for
manual settings.
[3D Format] tab
1
2
3
To specify display of coordinate values
Tap
1
, and then select “Rectangular*” (display rectangular coordinate
values), “Polar” (display polar coordinate values), or “Off” (turn off display
of coordinates).
To specify display of axes
Tap
2
and then select “On” (display axes normally), “Box” (display box
type coordinate axes), or “Off*” (turn off display of axes).
To turn display of Graph window axis labels on or off
Tap
3
and then select “On” or “Off*”.


