Chapter 13: Spreadsheet Application
238
Graph Colors and Color Link
Enabling Color Link (so there is a check mark next to it) on the Edit menu will cause the text color of the data
being graphed to be used when the data is graphed. Conversely, a color specified on the Graph window will be
applied as the text color of the corresponding data.
When Color Link is disabled (so there is no check mark next to it on the [Edit] - [Format] menu), graphing is
performed using default colors.
u
To use text colors as graph colors
Example:
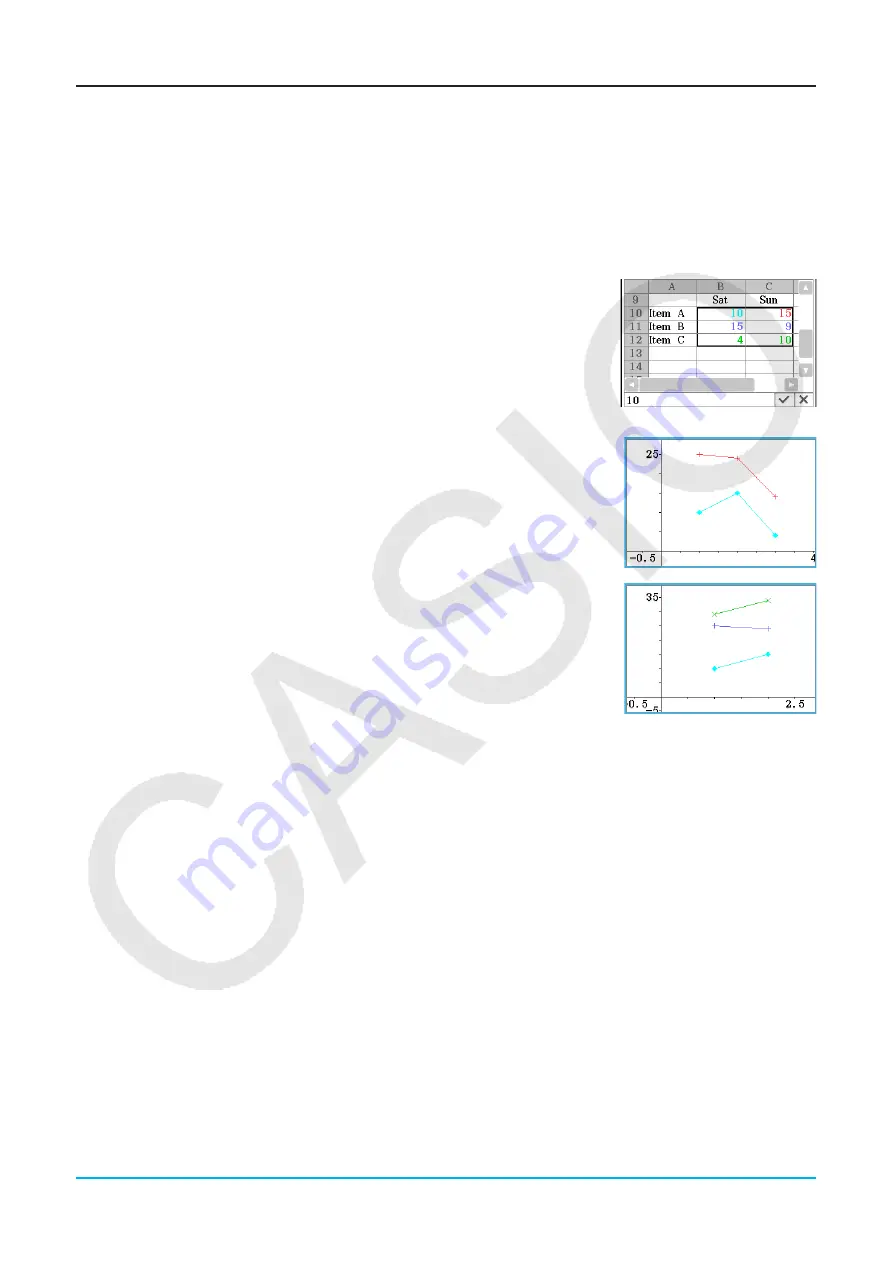
To draw a stacked line graph using the data in the nearby
screenshot, which is the same we graphed under “Column Series
and Row Series” (page 237)
1. Configure text color settings for each cell as shown in the nearby
screenshot.
• For information about color settings, see “Changing the Text Color and Fill
Color of Specific Cells” (page 233).
2. Tap [Graph] - [Column Series].
3. Tap [Edit] - [Format] - [Color Link] so there is a check mark next to [Color
Link].
4. Tap [Graph] - [Line] - [Stacked].
• This will draw a stacked line graph using the data colors.
5. Tap [Type] - [Row Series].
• This switches to a row series graph. For a line graph, the color of each
data’s first character (first row character in the case of Column Series, first
column character in the case of Row Series) is applied as the line color.
u
To specify the graph drawing color on the Graph window
Example:
To continue with the operation in the previous example and change the drawing color on the Graph
window
1. On the Graph window, select the point whose color you want to change by tapping it.
• Note that you cannot select a line. Line colors are always the same as the rightmost end point.
2. On the [Edit] menu, tap [Style].
• This displays the Style Settings dialog box.
3. Select the color you want and then tap [OK].
• This will change the point to the color you selected.
• Since there is a check mark next to [Color Link] on the [Edit] - [Format] menu, the corresponding data on
the Spreadsheet window will also change to the selected color.
Tip
• Changing the [Color Link] setting to either enabled (check mark next to it on the [Edit] - [Format] menu) or disabled (no
check mark) while a graph is displayed will cause the graph to be redrawn in accordance with the newly selected enabled/
disabled setting.
• When Color Link is enabled, the relationship between data text color and the graph color is as described below for each
type of graph.


