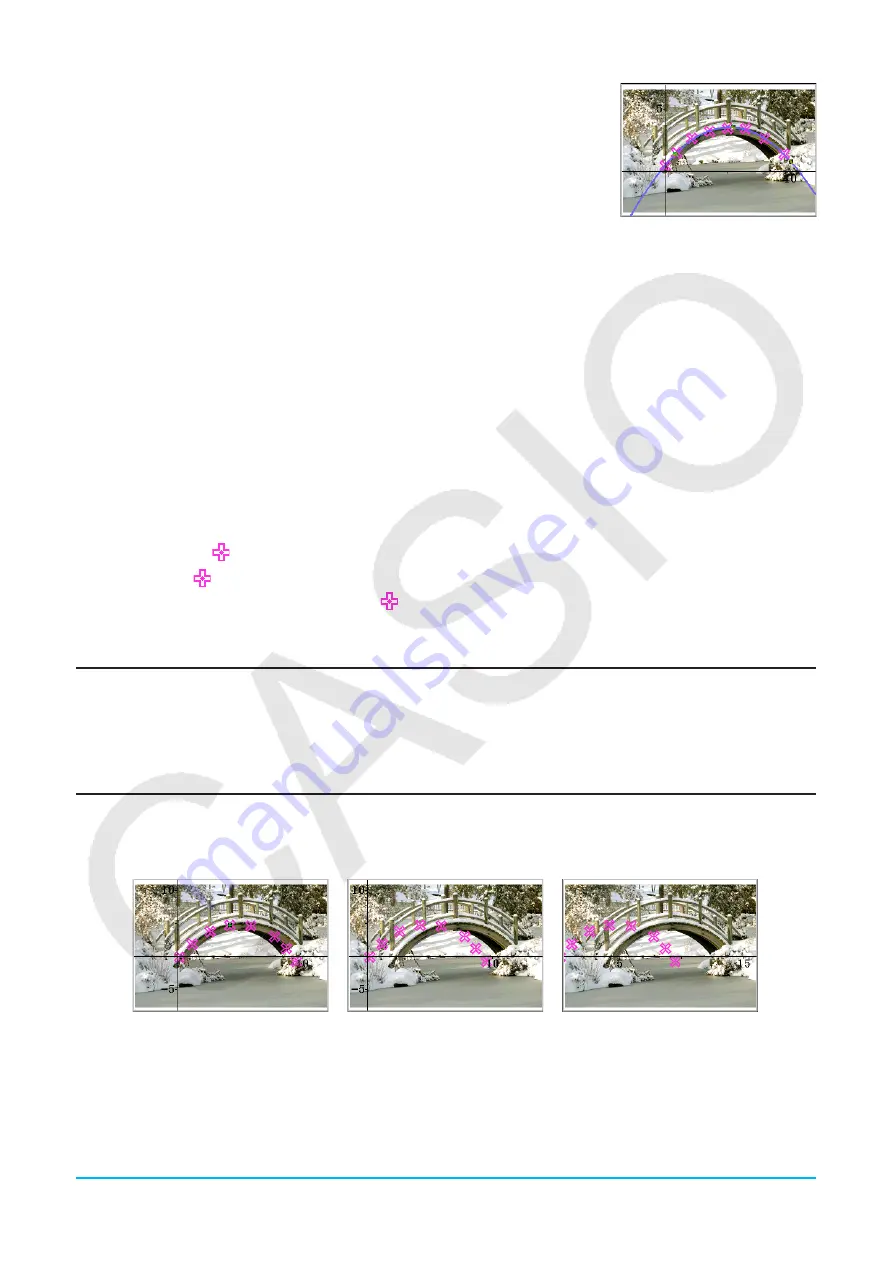
Chapter 15: Picture Plot Application
263
4. Tap [OK].
• This will graph the regression formula of the calculation results.
*1 For information about regression calculation types, see “Regression types” (page 138).
*2 This dialog box will appear when there is a check mark next to [DispStat] on the [Graph] menu. This menu
item has a check mark next to it under initial default settings.
For information about the meanings of the values that appear on this dialog box, see “To view regression
calculation results” (page 143).
u
To delete one of the graphs draw on the Picture Plot window
1. On the Picture Plot window, tap
G
or View - Select.
2. Tap the graph you want to delete.
• This will cause handles (
;
) to appear on the graph you tap to indicate that it is selected.
3. Tap [Edit] - [Delete].
u
To view the coordinates of a specific location on a graph (Trace)
1. Tap [Graph] - [Trace] or
K
.
• This will display
in the center of the Picture Plot window.
2. You can move
by tapping the location to which you want to move it.
• The coordinates at the current position of
will be shown in the status bar.
• To exit the Trace operation, press
c
.
G-Solve
You can use the G-Solve function to calculate the root, min, max, and
y
-intercept of the graph that is currently
selected on the Picture Plot window. Picture Plot window G-Solve operations are the same as those with the
Graph & Table application. For more information, see “3-6 Analyzing a Function Used to Draw a Graph”.
Scrolling the Picture Plot Window
On the Picture Plot window, you can use the cursor keys to scroll the XY-coordinate axes up, down, left, and
right. Note that the background image is fixed and does not scroll.
You also can tap View - Pan or
T
and pan (grab-and-drag) the XY-coordinate axes.


