Run Up / Coast Down Module
Displaying Acquired Data
Use the
Display Select
menu to analyse the recorded time waveform in one of five
display formats. Note that recorded data can be re
-analysed as often as necessary.
The five display formats are:
•
Bode
•
Nyquist
•
Table
•
Waterfall
•
Spectrogram
It is assumed that RUCD module users are familiar with analysis
methods for the above RUCD data display formats.
Bode Plot Display
For analysis purposes, setup options for how to best process and display the recorded
data for each display format are specified by the user prior to data display.
Bode Plot Setup
•
From the
RUCD – Display Select
menu, use arrow keys to highlight the
Bode
icon,
and press an Enter button. The
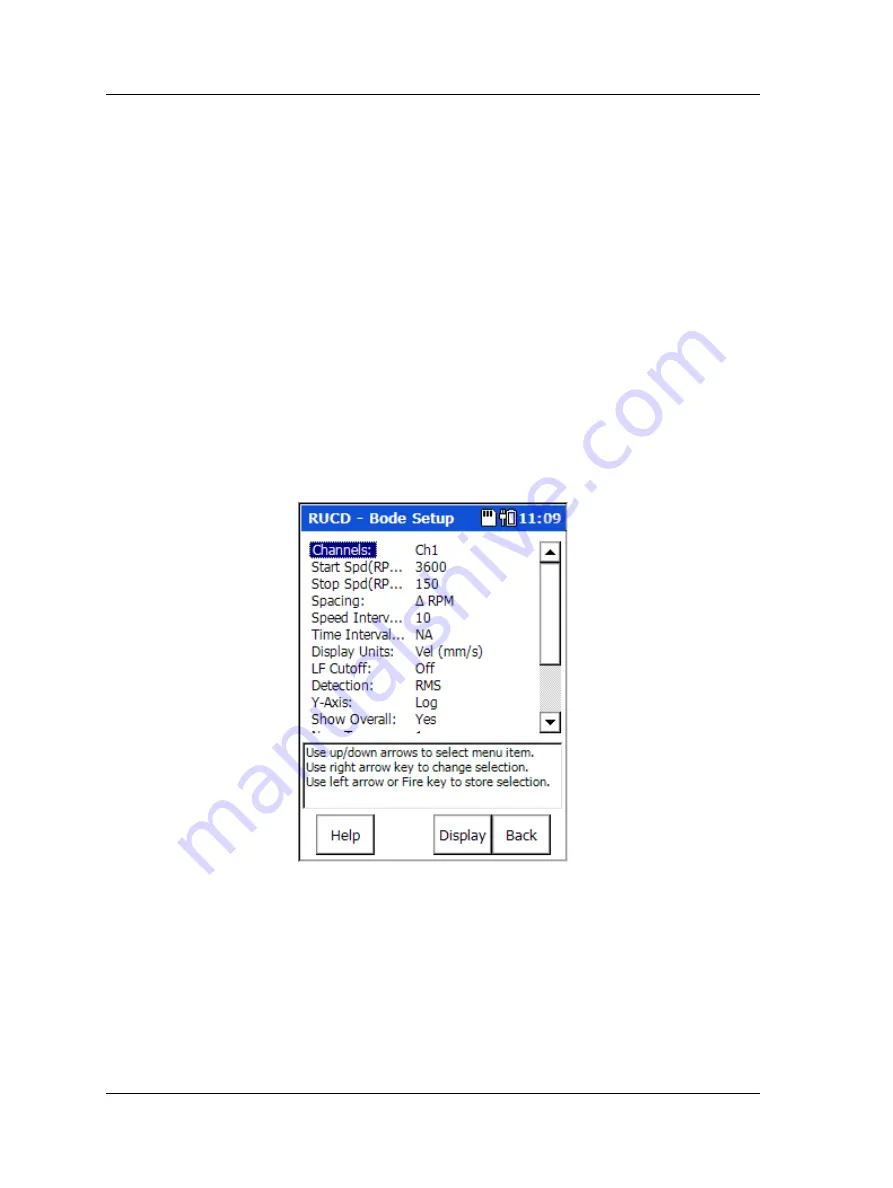
RUCD – Bode Setup
screen displays.
Figure 7 - 6.
The
Bode Setup
Screen.
Setup fields include:
Channels
– If multiple channels were recorded, specify which channel’s data to display
in the Bode plot.
Start Spd / Stop Spd (RPM)
– For the recorded data, determines the start and stop
speeds for Bode plot analysis.
7 - 8
SKF Microlog - GX Series
User Manual


