Hide
Annotations
Hides the
annotations
on the live image for the tool, even when the tool is selected.
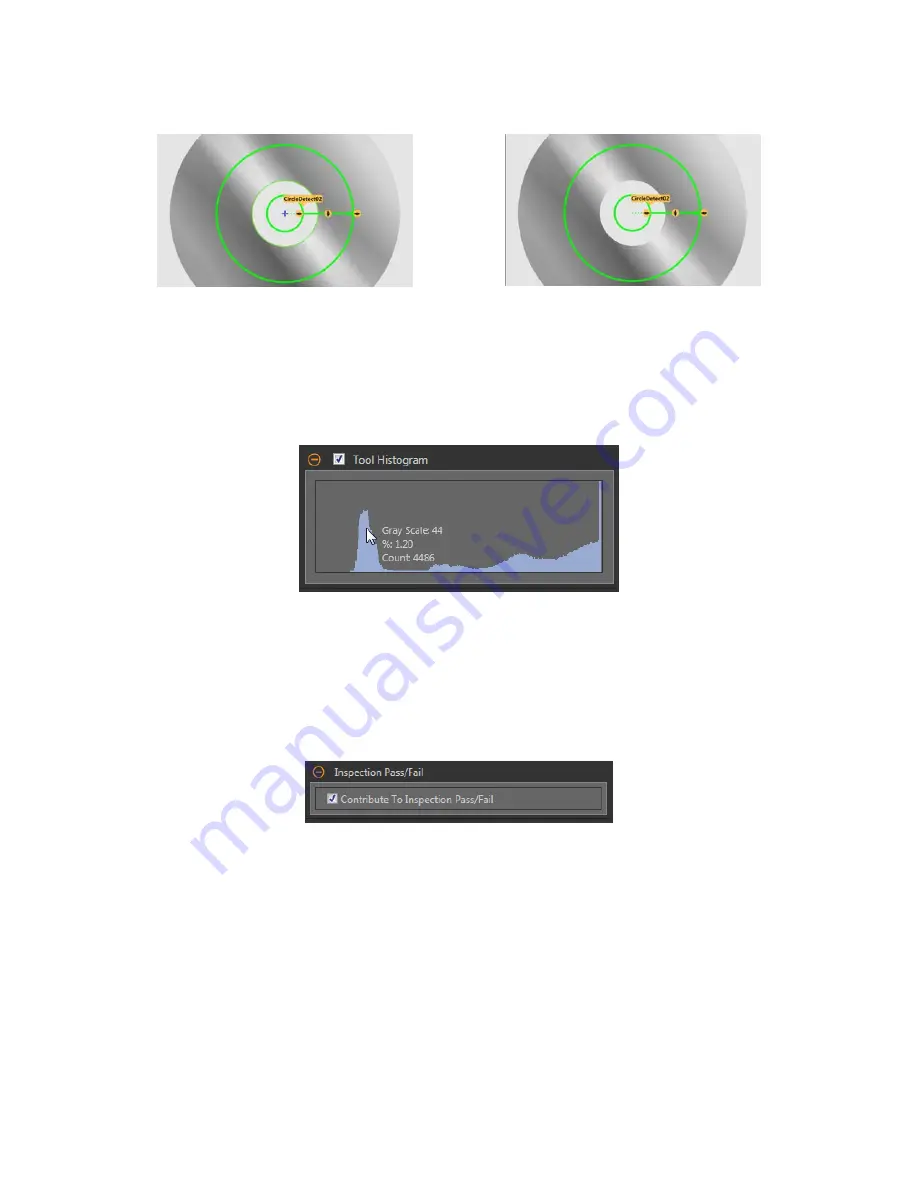
Figure 135. Show Circle Detect Tool
Annotations
Figure 136. Hide Circle Detect Tool
Annotations
Hide ROI
Hides the ROI when the tool is not selected.
Tool Histogram
The Tool Histogram graphically displays pixel intensity
information
within the current ROI.
Figure 137. Example Histogram
Select the Tool Histogram checkbox to enable the histogram. The default is enabled. Expand the Tool Histogram parameter to view the
histogram.
The histogram is a display of the grayscale values on the x axis and the number of pixels on the y axis. The histogram displays the
amount of pixels for each grayscale value. The graph displays
information
for all grayscale values (0 to 255). Move the pointer anywhere
over the histogram to view
specific
information.
The
information
updates as the
position
of the pointer changes.
Inspection
Pass/Fail
Select the Contribute to
Inspection
Pass/Fail check box (default) if the tool will
influence
the Pass/Fail status of the
inspection.
Figure 138.
Inspection
Pass/Fail
The Pass/Fail
contribution
influences
the following:
• Discrete output Pass
• Discrete output Fail
• Pass/Fail results counter
• Pass (Green) and Fail (red) LEDs on the Sensor
Select this checkbox if the overall Pass/Fail status of the
inspection
is dependent on the current tool.
8.5.2 Circle Detect Tool: Test Parameters
Use the Test parameters to
configure
the pass/fail
conditions
for the tool.
Select the parameter checkbox to enable it. Where applicable, the
vertical
green bar shows the current parameter
information
and the
light gray backgrounds show the range over which a value has varied over
time.
Where applicable, use the sliders or enter the minimum and maximum for the selected test parameters.
VE Series Smart Camera
www.bannerengineering.com - Tel: 763.544.3164
83


