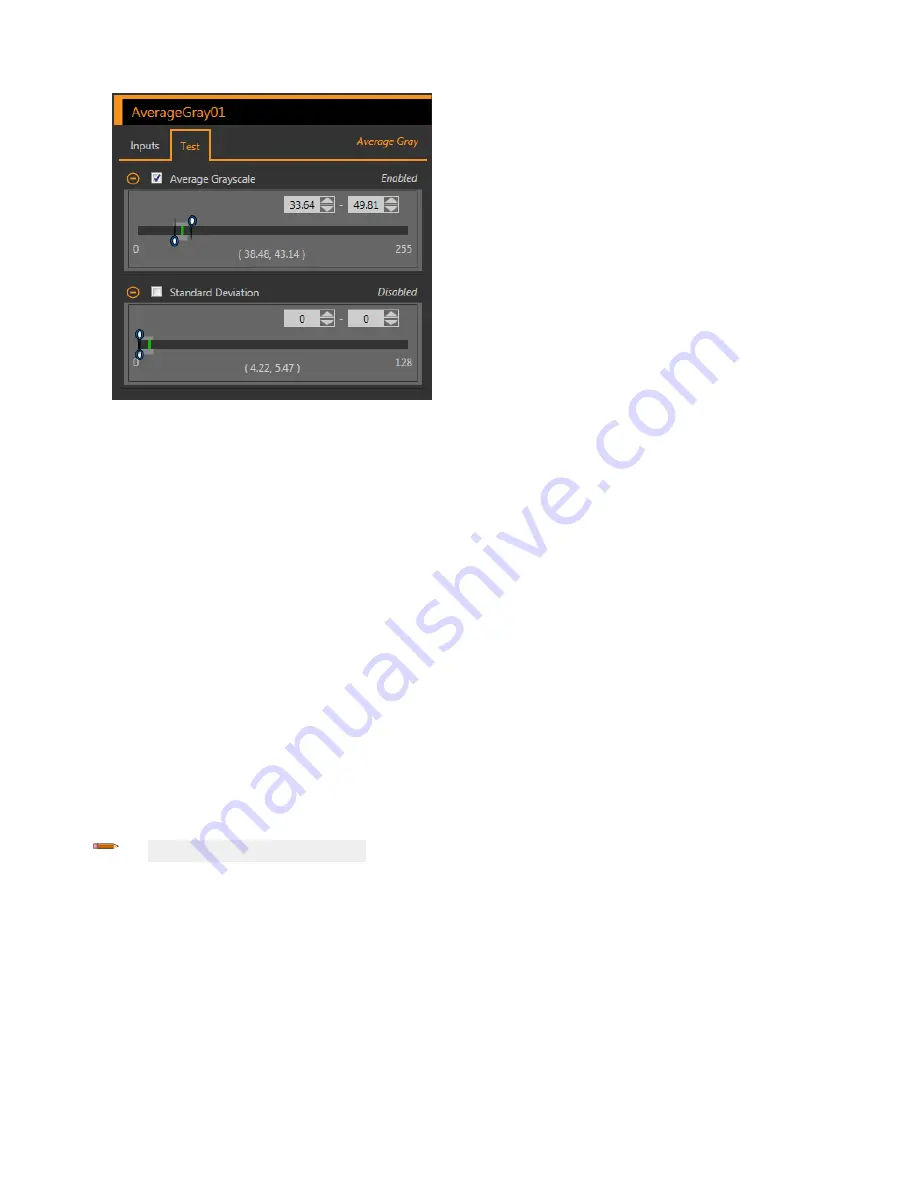
Figure 66. Average Gray Tool—Test Parameters
Average Grayscale
The grayscale value range.
Standard
Deviation
The standard
deviation
range.
8.1.3 Average Gray Tool: Results
Tools & Results and All Results list
information
from the current and previous
inspections.
A red box around a tool indicates that the tool failed. Status provides
information
about the
specific
failure.
All Results displays the Result, Time, Pass Count, and Fail Count
information
at a glance. Expand the
inspection
tool to see
specific
results for that tool.
Average Grayscale
The average grayscale value of the pixels in the ROI.
Standard
Deviation
The standard
deviation
of the average grayscale value for the pixels in the ROI.
Execution
Time
The
execution
time,
in milliseconds, for the currently selected tool in the current
inspection.
Expand
Execution
Time to see the historical minimum and maximum
execution
times
up to this point for the selected tool.
Use the reset
button
in the
Inspection
Summary to reset these historical values.
Status
Status and error messages display as appropriate.
8.1.4 Using the Average Gray Tool
Follow these steps for a typical presence/absence Average Gray
inspection.
Note: This procedure is an example only.
1. Add an Average Gray tool to the
inspection.
2. Adjust the ROI to frame the desired feature.
3. Set the Test parameters to set the pass/fail criteria.
a) On the Test tab, select the Average Grayscale checkbox.
This
option
sets the grayscale range that must be present in the ROI so that a part passes.
b) Move the sliders or enter the minimum and maximum grayscale.
Inspections
outside of this range will fail. For this example,
the minimum is 56.12 and the maximum is 74.83.
The green bar indicates the current grayscale and the light gray background indicates the grayscale over
time
since the last
reset.
VE Series Smart Camera
54
www.bannerengineering.com - Tel: 763.544.3164


