8
Operation and parameter setting on the PC with enSuite
Page 114 of
135
G a s Q u a l i t y A n a l y z e r
GasLab Q2
8.4.6
Function “Live data and trending“
With this function EnSuite offers the possibility to view live data of the device shown as numerical
value and graphically . First of all, you need a connection to the device (
See chapter 8.1.2).
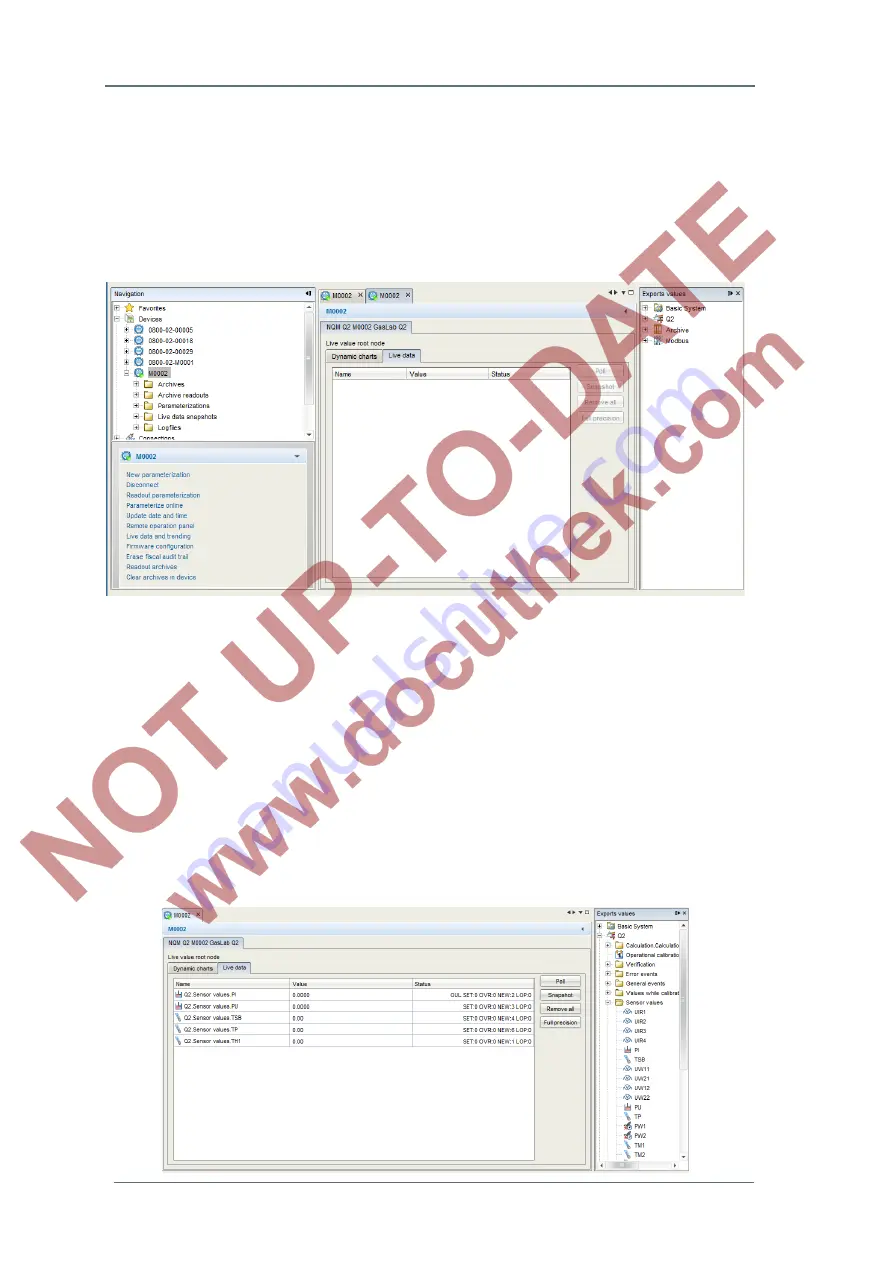
After you have gained access to the Q2, you can right-click on the Q2-symbol (on the left hand
side window). In the appearing list (Navigation Window lower part) select the point “
Live data and
trending
”. The parameters are read from the Q2 and then a new tab opens in the middle of the
screen (see figure).
In the window there are 2 tabs
„
Dynamic chart
” and "
Live data
". In the tab "
Live data
” you can
monitor many different types of data simultaneously, but you will only see the numerical value. In
the tab “
Dynamic Chart
” you can monitor just 2
groups
of values graphically.
Group
means: while
there are at most 2 vertical axes possible, there are only two positions to place the unit of the
value. As a consequence, you can place many different types of data here as long as they fall
into no more than two unit categories, i.e. if you already monitor 2 temperatures (in °C) and 1
pressure (in MPa), the possibilities are exhausted.
Examples of application
Tab "Live data”
On the right side there is a window showing all the values available in the device in a parameter
tree. You simply navigate to the value you want and click and drag the value to the middle
window (see following image detail).


