Getting Started
R&S
®
ZNL/ZNLE
69
User Manual 1178.5966.02 ─ 19
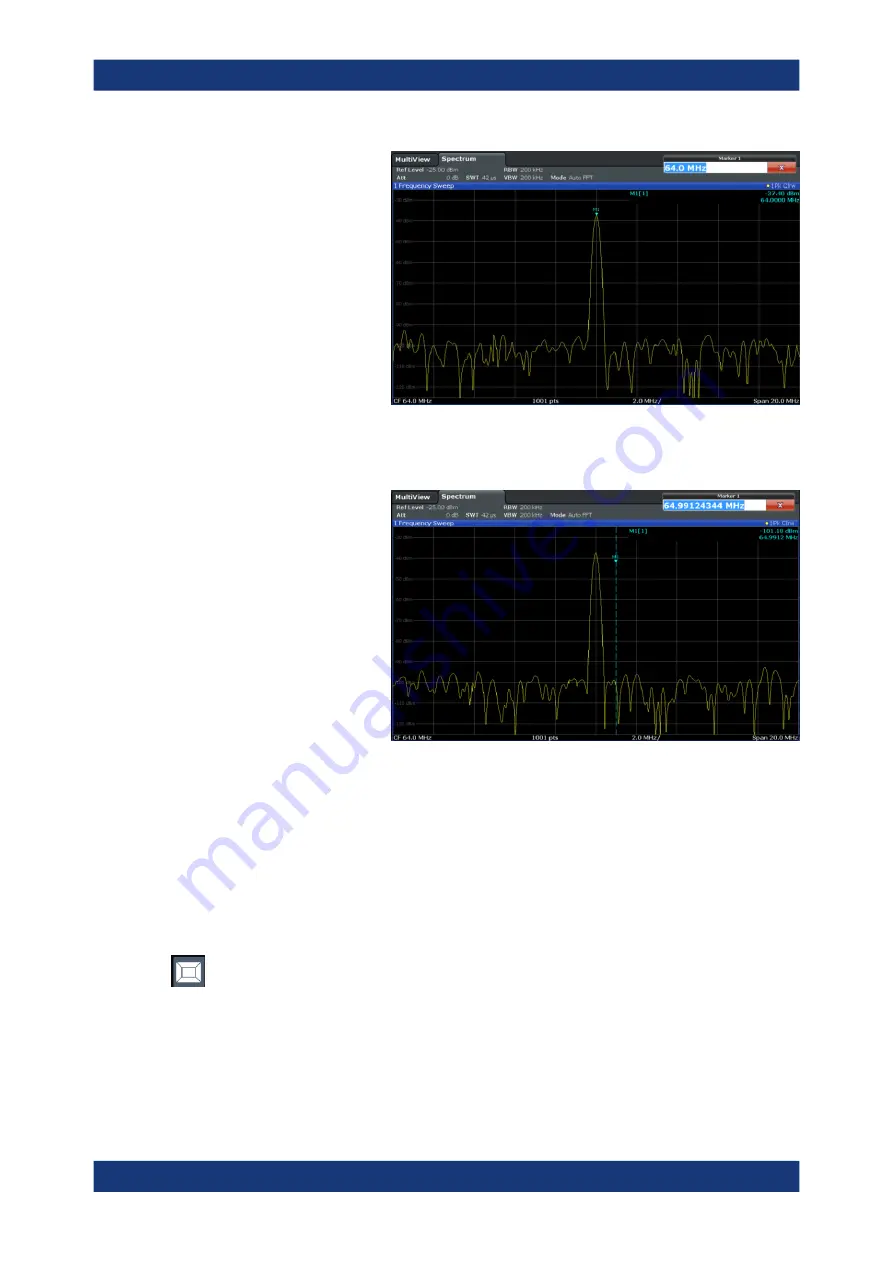
6. Now you can move the marker by tapping and dragging it to a different position.
The current position is indicated by a dotted blue line. Notice how the position and
value change in the marker area of the diagram.
4.3.6.4
Displaying a marker peak list
The marker peak list determines the frequencies and levels of peaks in the spectrum
automatically. We will display a marker peak list for the Spectrum 2 channel setup.
1. Tap the "Spectrum 2" tab.
2. Press the "RUN SINGLE" key on the front panel to perform a single sweep for
which we will determine the peaks.
3. Tap the "SmartGrid" icon in the toolbar to activate SmartGrid mode.
4. Drag the "Marker Peak List" icon from the evaluation bar to the lower half of the
display to add a new window for the peak list.
5. Close the SmartGrid mode.
Trying out the instrument


