Getting Started
R&S
®
ZNL/ZNLE
68
User Manual 1178.5966.02 ─ 19
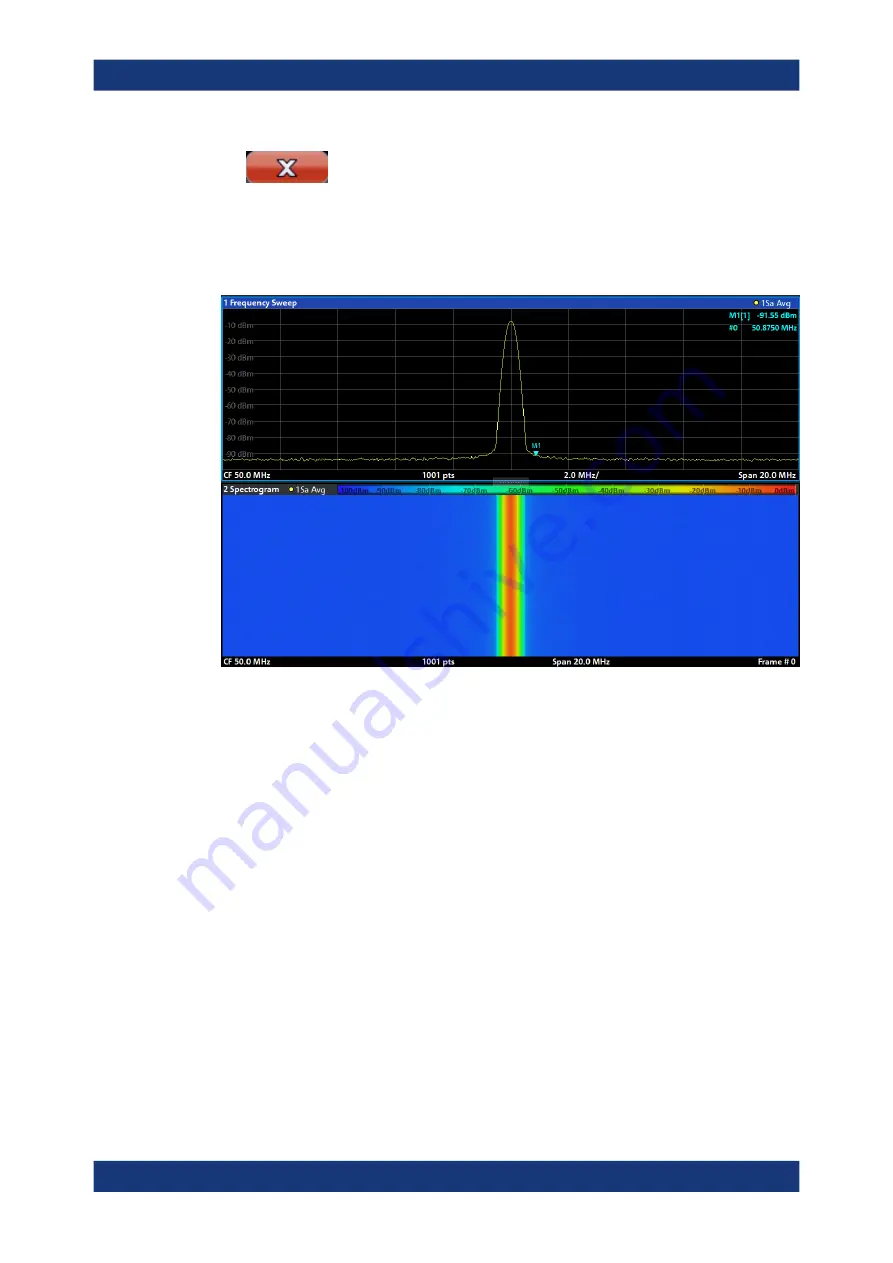
You see the spectrogram compared to the standard spectrum display. Since the
calibration signal does not change over time, the color of the frequency levels does
not change over time, i.e. vertically. The legend at the top of the spectrogram win-
dow describes the power levels the colors represent.
Figure 4-14: Spectrogram of the calibration signal
4.3.6.3
Setting and moving a marker
Markers are useful to determine the position of particular effects in the trace. The most
common use is to determine a peak, which is the default setting when you activate a
marker. We will set a marker on the peak in our first Spectrum measurement.
1. In the "MultiView" tab, double-tap the "Spectrum" window (frequency sweep with
spectrogram display) to return to the "Spectrum" channel setup.
2. Tap the spectrum display to set the focus on that window.
3. Double-tap the spectrum window to maximize it, as we currently do not need the
spectrogram display.
4. Press the "RUN SINGLE" key on the front panel to perform a single sweep so we
have a fixed trace to set a marker on.
5. Press the [MKR] key on the front panel to display the "Marker" menu.
Marker 1 is activated and automatically set to the maximum of trace 1. The marker
position and value is indicated in the diagram area as M1[1].
Trying out the instrument


