


T
T
h
h
e
e
M
M
e
e
n
n
u
u
B
B
a
a
r
r
f
f
u
u
n
n
c
c
t
t
i
i
o
o
n
n
s
s
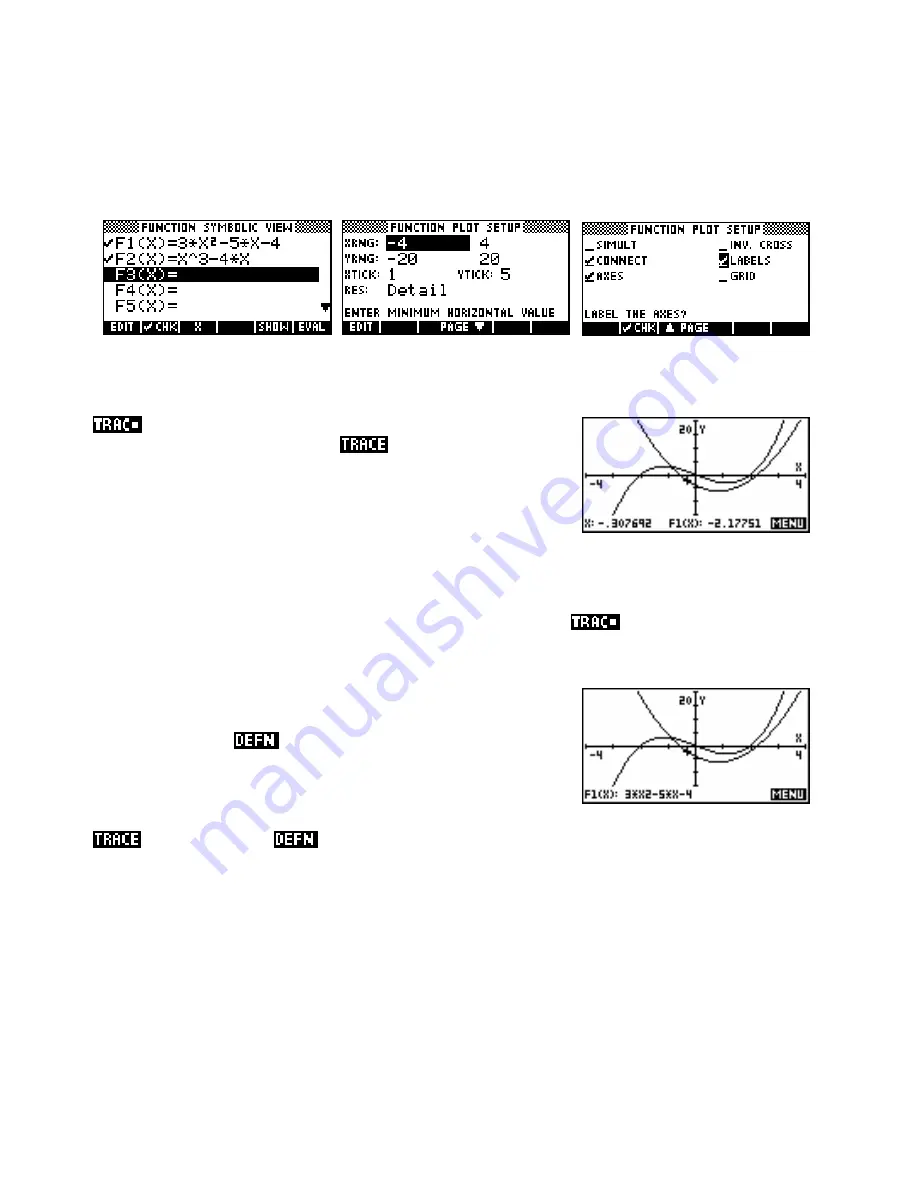
In the examples and explanations which follow, the functions and settings used are:
Trace
is quite a useful tool. The dot next to the word means that it is
currently switched on. If yours shows
instead then press the key
underneath to turn it on. Leave it on for now.
Press the left arrow 5 or 6 times to see a similar display to that shown
right. Pressing up or down arrow moves from function to function.
The order used when moving from graph to graph is not related to the physical location of the graphs on the
screen but rather to the order that they are defined in the
SYMB
view. If
is turned off then the cursor
is free to move anywhere on the screen.
Defn
(short for
Definition
). You will find that the
equation is now listed at the bottom of the screen.
Press the key labeled
The up/down arrows will move the cursor from F1(X) to F2(X), with the definition changing as it does so. If
is switched off then
will not work correctly, nor will various other useful tools.
However, it does have the advantage that the cursor can be freely moved around the screen with the current
coordinates displayed at the bottom of the screen. For this aspect to work properly you really need to choose
a scale where the pixels are on ‘nice’ numbers. Multiples or fractions of the default scale are best for this.
53