


21
T
T
H
H
E
E
E
E
X
X
P
P
E
E
R
R
T
T
:
:
M
M
A
A
N
N
I
I
P
P
U
U
L
L
A
A
T
T
I
I
N
N
G
G
C
C
O
O
L
L
U
U
M
M
N
N
S
S
&
&
E
E
Q
Q
N
N
S
S
New columns as functions of old
As with univariate statistics, you can use functions of old columns as new
sets of data. See the Univariate version of this section for two different
ways of doing this.
For example, a set of data (
C1,C2
) that you suspect is exponential could be straightened by setting up
S2:
as
(
C1,LN(C2)
).
The effects of changes of scale and origin on data and summary statistics can be investigated in this way by
storing, for example,
-2*C2+3
into
C2
. You can even combine columns in this way, such as storing
C1+C2
into
C3
.
in calculations
Using values from
It is often useful to be able to retrieve values such as the mean and standard deviation for use in further
calculations. With most simpler calculators these values are found by pressing keys rather than reading from
a
screen, so doing a calculation like ‘multiply the mean by 3.5’ is not hard. The values shown on the
screen can also be retrieved for use on the calculator relatively easily.
For example, the set of data below contains a suspected outlier (erroneous value). In this case one might
suspect a missing comma between the last two values.
{2, 3, 5, 2, 1, 5, 3, 6, 7, -2, 3, 5, 5, 55}
One possible test for outliers is to calculate the mean and standard
deviation without the presence of the suspected outlier, and then to
check whether the suspect piece of data is within three standard
deviations of the mean. If not, then it is discarded.
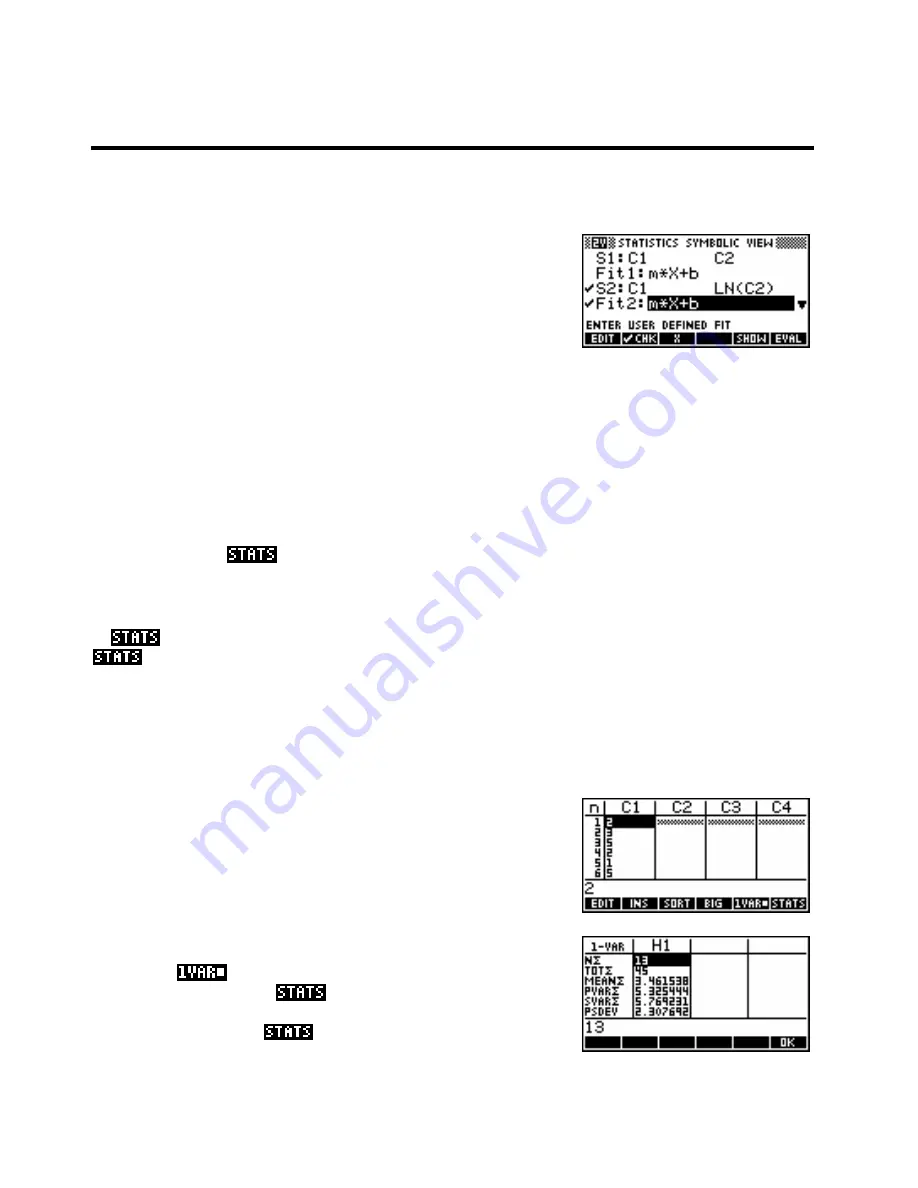
Enter the data without the suspected outlier into column C1 with the
calculator in
mode. Ensure that the
SYMB
view is set up
correctly and then press the
key.
As you can see on the right, the values of the mean and standard
deviation are given in the
screen to 12 significant digits.
133