43
A
A
P
P
P
P
E
E
N
N
D
D
I
I
X
X
B
B
:
:
T
T
E
E
A
A
C
C
H
H
I
I
N
N
G
G
O
O
R
R
L
L
E
E
A
A
R
R
N
N
I
I
N
N
G
G
C
C
A
A
L
L
C
C
U
U
L
L
U
U
S
S
There are many ways that the teaching or learning of functions and calculus concepts can be enhanced with
the aid of a graphical calculator. Some of them are listed below:
I
I
n
n
v
v
e
e
s
s
t
t
i
i
g
g
a
a
t
t
i
i
n
n
g
g
t
t
h
h
e
e
g
g
r
r
a
a
p
p
h
h
s
s
o
o
f
f
y
y
=
=
x
x
n
n
f
f
o
o
r
r
n
n
a
a
n
n
i
i
n
n
t
t
e
e
g
g
e
e
r
r
This is a task often given to introductory calculus classes and can be
done most economically by setting an investigative task, perhaps for
homework.
Save a copy of the Function aplet under the name of
“X to the N”. Saving the aplet will allow you (the teacher) to send it to
your students’ calculators.
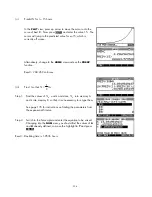
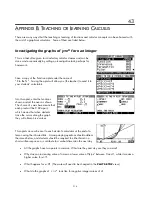
Into this aplet, enter the functions
shown and set the axes as shown.
The choice of x axis here means that
each pixel will be 0.02 apart,
which means that when students
trace the cursor along the graph
they will obtain ‘nice’ values.
This aplet can now be sent to each student’s calculator at the end of a
lesson using the infra-red link. Accompanying questions should address
the issues below, and students should be required to either hand in a
short written response, or contribute to a verbal discussion the next day.
•
All the graphs have two points in common. What are they and why are they common?
•
Why does an increasing value of
n
mean a lower value of f(x)=x
n
between 0 and 1, while it means a
higher value for x>1?
•
What happens for x<0? (The scale will need to be changed in the
PLOT SETUP
view.)
•
What do the graphs of
y
x
n
look like for negative integer values of n?
=
314


