


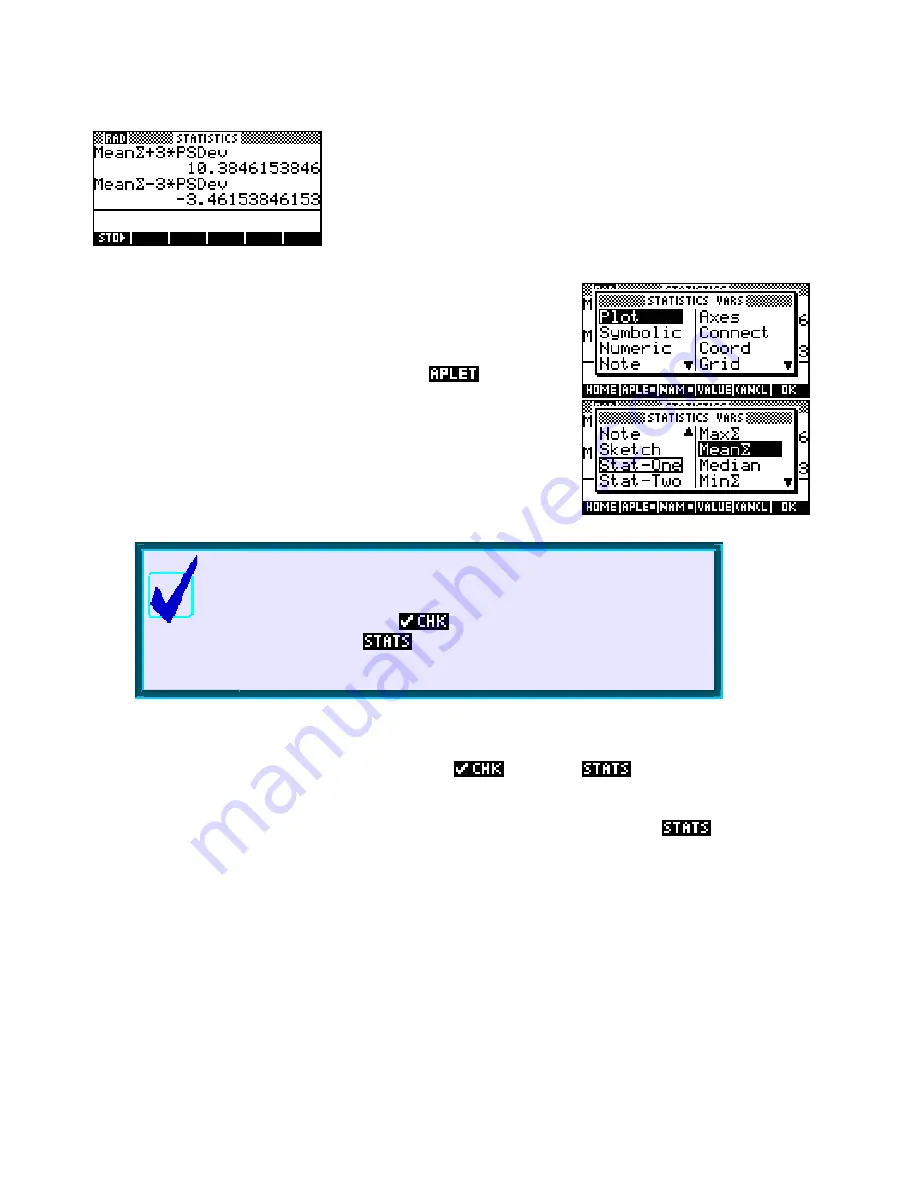
If we now switch to the
HOME
view, we can recall these values and use
them in a calculation to find the upper and lower cut off points for
acceptance of data.
As you can see on the left, the range for acceptance is -3.46 to 10.38,
which makes the value of 55 almost certainly an error.
There are two ways to obtain these values. You can type them into the
HOME
view using the
ALPHA
key, or you can use the
VARS
key
instead.
If you press
VARS
and then the screen key labeled
then,
assuming the Statistics aplet is active, you will see the view above right.
Scroll down to the
Stat-One
variables and then press the right arrow.
This puts you in the list (see right) of univariate summary statistics. If you
highlight one and press
ENTER
then the variable name will be pasted
into the
HOME
view for use. People often find it easier to simply type
them. You can obtain the summation sign in
Mean
Σ
by using
SHIFT +
.
Calculator Tip
the
.
NUM
HOME
The values of the mean and standard deviation retrieved are those of
last set calculated
If you have more than one set of data in the
view then firstly un
all except the one you want, and
secondly press the
key in order to force a calculation of the
values you want. This ensures that the ones you retrieve in the
view are the ones you want.
This technique can also be used for bivariate data in exactly the same manner. You should ensure, as per the
note above, that only the set of data you want to use is
ed and that
have been displayed for it.
coefficients of the line of best fit, since they appear in the
All the usual values are retrievable, with the exception that there is no way to provided to retrieve the
SYMB
screen rather than the
screen.
134