

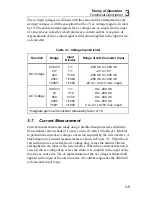


Theory of Operation
Functional Description
3
3-5
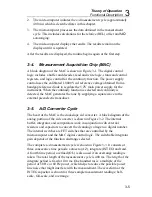
2.
The microcomputer initiates the a/d measurement cycle (approximately
400 ms) which is described later in this chapter.
3.
The microcomputer processes the data obtained in the measurement
cycle. This includes calculations for the relative (REL) offset and M
Ω
autoranging.
4.
The microcomputer displays the results. The results remain on the
display until it is updated.
After the results are displayed, the routine begins again at the first step.
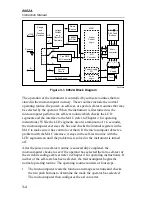
3-4.
Measurement Acquisition Chip (MAC)
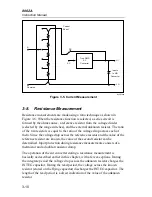
A block diagram of the MAC is shown in Figure 3-1. The digital control
logic includes a buffer and decoder, read and write logic, status and control
registers, and logic control for the continuity function. The power supply
control uses the calibrated 1.0000V a/d reference voltage obtained from a
bandgap reference diode to regulate the 5.2V main power supply for the
instrument. When the continuity function is selected and continuity is
detected, the MAC generates the tone by supplying a square wave to the
external piezoelectic transducer.
3-5. A/D
Converter
Cycle
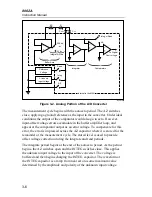
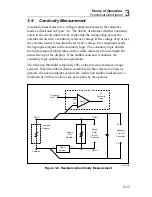
The heart of the MAC is the dual-slope a/d converter. A block diagram of the
analog portion of the a/d converter is shown in Figure 3-2. The internal
buffer, integrator, and comparators work in conjunction with external
resistors and capacitors to convert the dc analog voltage to a digital number.
The internal switches are FET switches that are controlled by the
microcomputer and the MAC digital control logic. The switchable integrator
gain depends of the function and range selected.
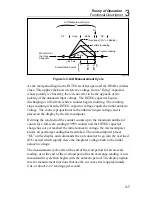
The complete a/d measurement cycle is shown in Figure 3-3. It consists of
three consecutive time periods: autozero (AZ), integrate (INTEG) and read.
A fourth time period, overload (OL) is also used if an overrange reading is
taken. The total length of the measurement cycle is 400 ms. The length of the
integrate period is fixed at 100 ms. One hundred ms is a multiple of the
period of 50 Hz or 60 Hz power, which helps to reduce the possible power
line noise that might interfere with the measurement. The waveform at the
INTEG capacitor is shown for three sample measurement readings: half-
scale, full-scale, and overrange.
Summary of Contents for 8062A
Page 4: ......
Page 8: ...8062A Instruction Manual iv...
Page 10: ...8062A Instruction Manual vi...
Page 14: ...8062A Instruction Manual 1 2...
Page 24: ...8062A Instruction Manual 2 2...
Page 50: ...8062A Instruction Manual 2 28...
Page 52: ...8062A Instruction Manual 3 2...
Page 62: ...8062A Instruction Manual 3 12...
Page 64: ...8062A Instruction Manual 4 2...
Page 90: ...8062A Instruction Manual 4 28...
Page 92: ...8062A Instruction Manual 5 2...
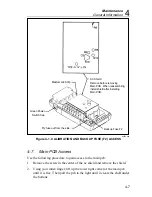
Page 102: ...8062A Instruction Manual 5 12 8062A 4031 iv39c eps Figure 5 2 A1 Main PCB Assembly...
Page 106: ...8062A Instruction Manual 6 2...
Page 108: ...8062A Instruction Manual 6 4 dy55c eps Figure 6 1 Accessories...
Page 118: ...8062A Instruction Manual 7 2...
Page 122: ...8062A Instruction Manual 7 6...
Page 123: ...8062A Instruction Manual 7 7 8062A 1201 iu46c eps Figure 7 5 A1 Main PCB Schmatic Diagram...
Page 124: ...8062A Instruction Manual 7 8 8060A 1003 iu61f eps Figure 7 6 A3 RMS PCB Schmatic Diagram...


