298
Traffic Flow Portlet | Traffic Flow Analyzer
Expanded Traffic Flow Portlet
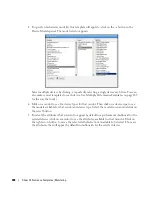
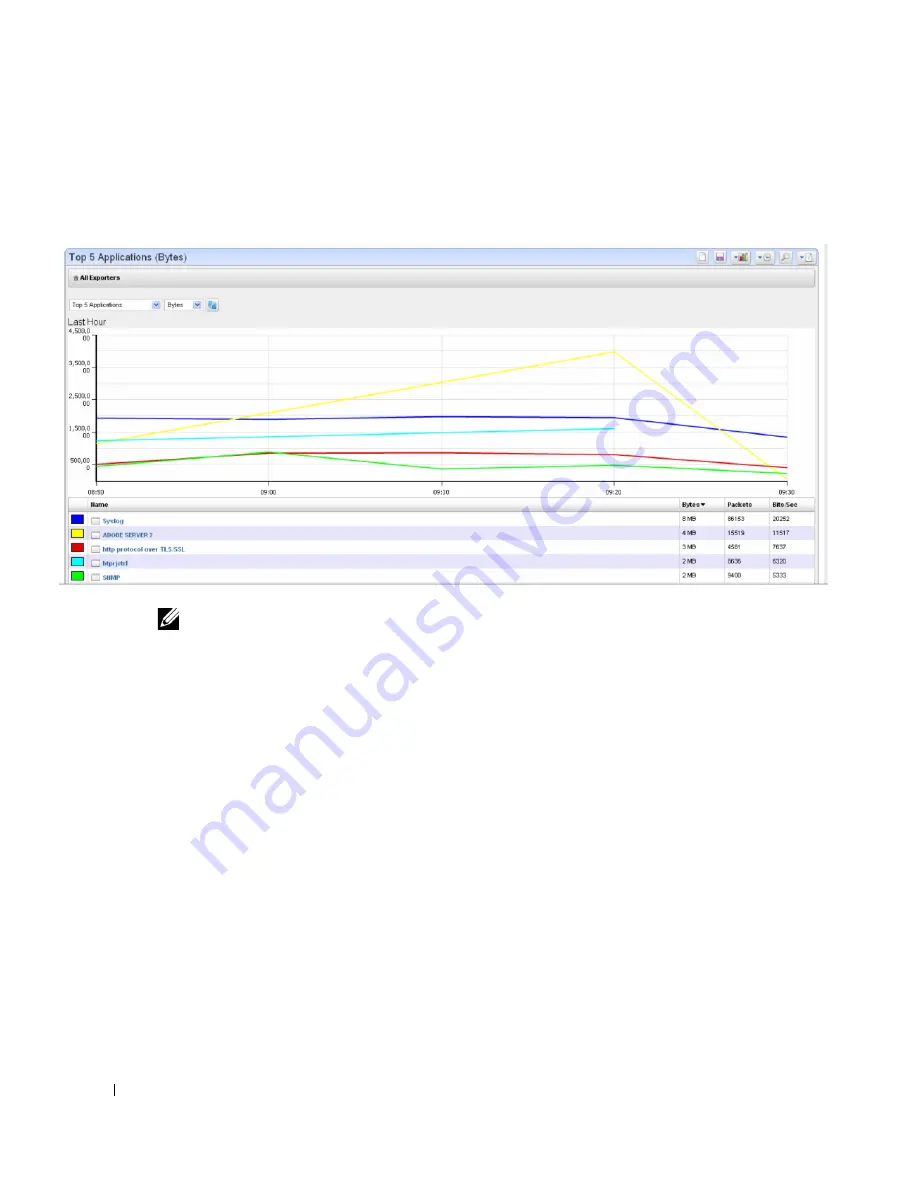
When you expand the portlet, a more complex interactive view appears. Initially, it displays a line
graph for the selected period.
NOTE:
It may seem a device reporting the same value as others is not graphed properly, but mousing over the
graph displays the value.
The following controls appear in its title bar:
Select Chart Type
—Lets you change the chart type. Available chart types include
Pie, Line, Bar,
Stacked Bar
and
Column
.
Select Timeframe
—Lets you change the period between
Last 15 Minutes, Last Hour, Last 24
Hours, Last 5 Days
and
Last 30 Days.
Search
—Displays a search dialogue to find specific traffic data.
Report Type
—Lets you change the report type between Top 5, 10 or 25 and Bottom 5, 10 or 25.
Load View
—Loads a saved traffic flow view, created with the
Save
button.
Save
—Saves the current view to a named view.
Below the title bar a navigation bar displays the context path. See Drill Down, below, for more
about this.
Below that navigation bar a row containing the following controls appear:
Entity Type
—Selects the type of entity to report on (Conversations, End points, and so on).
Attribute
—Selects which attribute to graph (Bytes, Packets, Bits/Sec).
Summary of Contents for OpenManage Network Manager
Page 1: ...Dell OpenManage Network Manager version 5 1 Web Client Guide ...
Page 14: ...14 A Note About Performance Preface ...
Page 98: ...98 Schedules Portal Conventions ...
Page 142: ...142 Vendors Key Portlets ...
Page 232: ...232 File Management File Servers ...
Page 242: ...242 Deploy Configuration ...
Page 290: ...290 Key Metric Editor Monitoring Metrics This panel s display depends on the selected device ...
Page 340: ...340 ...
Page 374: ...374 Adaptive CLI Records Archiving Policy Actions and Adaptive CLI ...
Page 380: ...380 Glossary ...
Page 388: ...388 388 Index ...


