100
Alarms | Key Portlets
The chart can act as a filter, too. For example, clicking the
Critical
alarms slice means only
Critical
alarms appear listed. Notice also that the chart “explodes” to highlight the selected slice. Hover the
cursor over a portion of the chart and a tooltip with information about that slice also appears.
By default, the chart appears only when there are alarms. See Configuring the Alarms Chart below
for options available in configuring the display. See Menu on page 102 for details about menu items
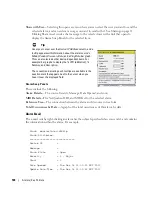
available when you right-click in the summary and expanded portlets. The following columns
appear in this screen by default:
Severity
—The alarm severity indicated by the color of the leftmost icon. The severity only has
meaning for Alarms and Security Alarms. Informational Alarms get a severity level of
Indeterminate. Closed alarms appear without color.
Date Opened
—The date the alarm appeared.
Entity Name
—The entity emitting this alarm (often within the Equipment).
DeviceIP
—The IP address of the equipment where the alarm appeared.
Event Name
—The event associated with the alarm.
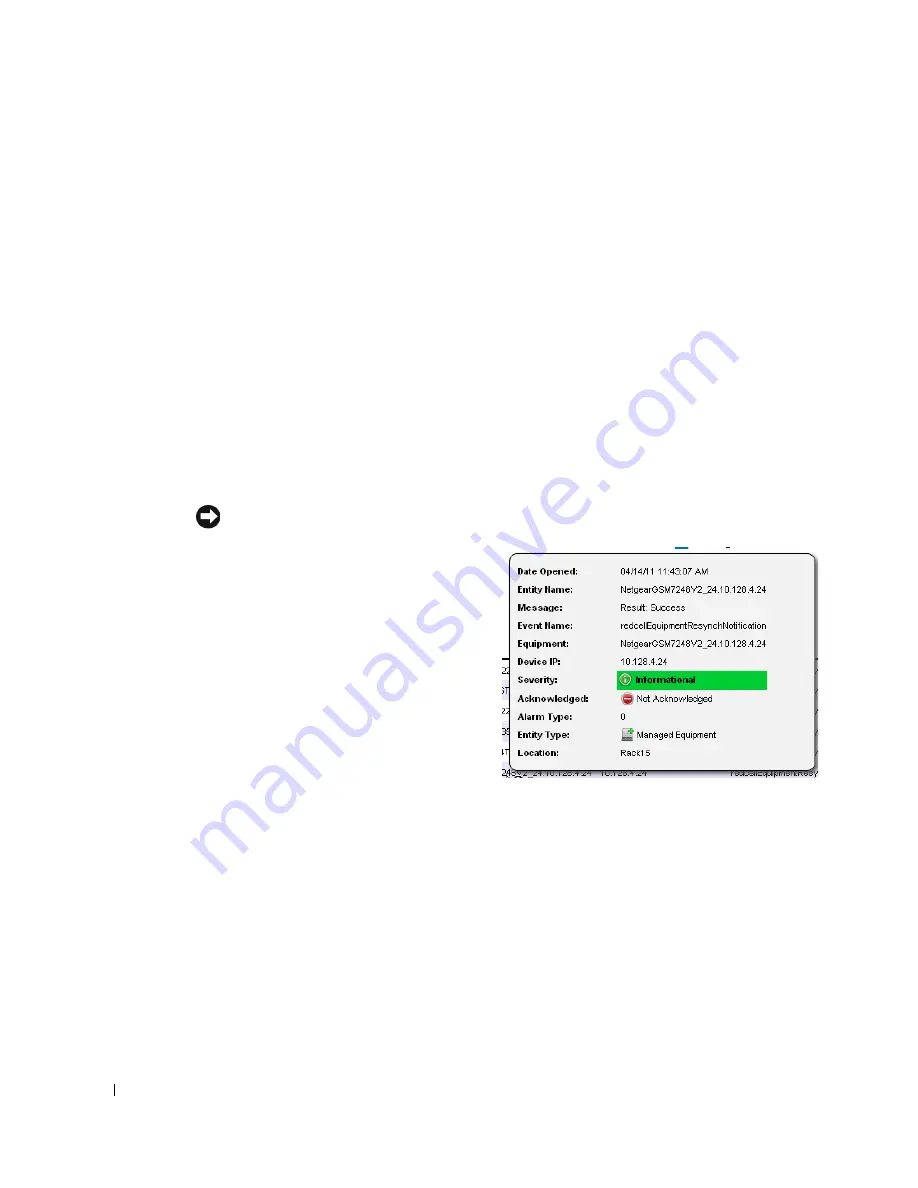
Tip
If you hover the cursor over a row in the portlet
display, a tooltip appears with information
about the alarm. This can include the alarm’s
Date Opened,
the
Entity Name,
any alarm
Message, Event Name, Alarm
and
Entity Type,
its status as
Service Effecting, Notification OID,
Equipment, Severity,
whether the alarm was
Suppressed,
or
Acknowledged
and the
Device
IP.
If an alarm is
Service Effecting,
(reflect an
impact on a service) it can propagate to appear
as components of service- and link-related
alarms. Service-effecting alarms are of
indeterminate or greater severity.
See Alarms in Visualizations / Topologies on page 219 for a description of how alarms appear in the
topology portlet. The next section (Expanded Alarm Portlet) describes alarm actions and
additional alarm capabilities.
Summary of Contents for OpenManage Network Manager
Page 1: ...Dell OpenManage Network Manager version 5 1 Web Client Guide ...
Page 14: ...14 A Note About Performance Preface ...
Page 98: ...98 Schedules Portal Conventions ...
Page 142: ...142 Vendors Key Portlets ...
Page 232: ...232 File Management File Servers ...
Page 242: ...242 Deploy Configuration ...
Page 290: ...290 Key Metric Editor Monitoring Metrics This panel s display depends on the selected device ...
Page 340: ...340 ...
Page 374: ...374 Adaptive CLI Records Archiving Policy Actions and Adaptive CLI ...
Page 380: ...380 Glossary ...
Page 388: ...388 388 Index ...


