| Visualize My Network
215
Icons
The the icons next to listed devices mean the following:
In the GRAPH INVENTORY tab (not the topology), the icons to the left of the devices are alarm
icons, and their color reflects the highest alarm state on that device. Icons that appear on the right
in the summary tree view displays the highest alarm severity for that type of device.
Icon
Type
Explanation
Alarm
This shows the alarm state of the devices listed.
In a composite list, like appears in Inventory, it
shows the highest alarm state.
Indeterminate
No alarm information is available for this device.
Status
Green means the device is Online, red means
Offline, and yellow means indeterminate.
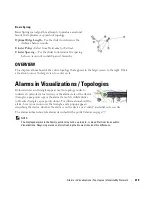
Topology Alarm
Triangle
These appear next to the device icons. The
upward pointing triangle indicates the icon
attached is a top-level device. The color in the
circle is connection status color described above.
The color in the triangle the device’s alarm state.
If the triangle points down, it indicates the
triangle’s alarm state color comes from a “child”
component of the node.
Summary of Contents for OpenManage Network Manager
Page 1: ...Dell OpenManage Network Manager version 5 1 Web Client Guide ...
Page 14: ...14 A Note About Performance Preface ...
Page 98: ...98 Schedules Portal Conventions ...
Page 142: ...142 Vendors Key Portlets ...
Page 232: ...232 File Management File Servers ...
Page 242: ...242 Deploy Configuration ...
Page 290: ...290 Key Metric Editor Monitoring Metrics This panel s display depends on the selected device ...
Page 340: ...340 ...
Page 374: ...374 Adaptive CLI Records Archiving Policy Actions and Adaptive CLI ...
Page 380: ...380 Glossary ...
Page 388: ...388 388 Index ...


