208
| Visualize My Network
Configuring Views
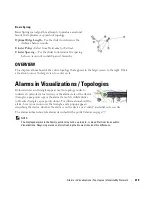
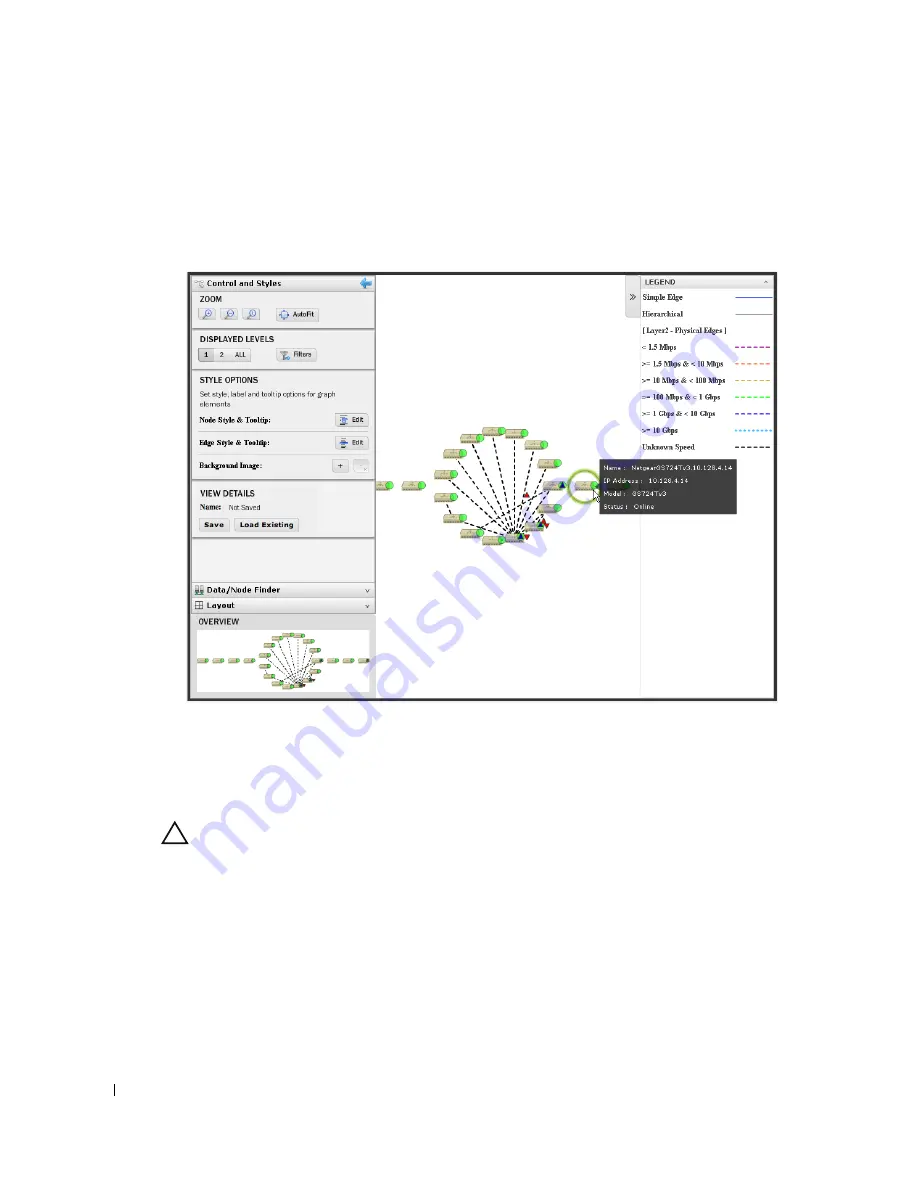
Click and drag displayed portions of this screen to see other parts of the topology. To move the
display more, click in the OVERVIEW panel. You can also expand / collapse the panels on the left
of the screen by clicking their title bars. (Figures below display them expanded.)
Hover the cursor over an icon or link between icons to see a small screen describing its contents and
alarm state. Click an icon to highlight it (or click its name in the GRAPH INVENTORY tab list)
and its connections to the network. See Alarms in Visualizations / Topologies on page 219 for more
about the alarm states indicated by icons in topology.
CAUTION:
If you have installed a firewall on the application server, ports 80 and 8080 must both be open for topology
to work.
Click the double arrows in the upper right corner to open the
Legend
for this screen, which
describes the link colors and their meaning. Hover the cursor over a link to see its type described.
See Icons on page 215 for an explanation of the icons that appear in these screens.
The screen to the left of the map displays the following panels:
• Control and Styles (which includes VIEW DETAILS)
• Data / Node Finder
• Layout
Summary of Contents for OpenManage Network Manager
Page 1: ...Dell OpenManage Network Manager version 5 1 Web Client Guide ...
Page 14: ...14 A Note About Performance Preface ...
Page 98: ...98 Schedules Portal Conventions ...
Page 142: ...142 Vendors Key Portlets ...
Page 232: ...232 File Management File Servers ...
Page 242: ...242 Deploy Configuration ...
Page 290: ...290 Key Metric Editor Monitoring Metrics This panel s display depends on the selected device ...
Page 340: ...340 ...
Page 374: ...374 Adaptive CLI Records Archiving Policy Actions and Adaptive CLI ...
Page 380: ...380 Glossary ...
Page 388: ...388 388 Index ...


