264
Resource Monitors | Monitoring
3
In the
General
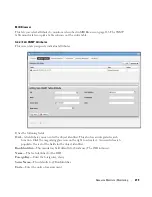
screen, enter a name (Test ICMP Monitor), and a polling interval (5 minutes
is the default). For this example, check
Retain polled data
and accept the remaining defaults
for checkboxes and the retention policy.
4
Select an entity to monitor by clicking the
Add
button in the top portion of the
Monitor
Options
screen.
5
Select devices you want to ping, (Ctrl+click to add more than one), then click
Add Selection
then
Done
to confirm your entity.
6
Define packets in the ICMP Monitor Options panel, including Packet Size, Packet Count and
timeout. You can accept the defaults here, too.
7
In the Thresholds tab, select an attribute (MaxRTT, or maximum round trip time) and add
the following thresholds by clicking
Add
:
Name
High
color red, Lower Boundary 15 and Upper Boundary [blank] Severity
Critical
Name
Fine
color green, Lower Boundary 0 and Upper Boundary 15 Severity
Cleared
.
Notice that this example does not emit a notification. If you checked that checkbox, an alarm
of the configured severity would accompany crossing the threshold.
8
Accept the other defaults and click
Apply
9
Click
Save.
10
Test ICMP Monitor now appears in the portlet.
How To:
Create a Key Metrics Monitor
Follow these steps to create a Key Metrics Monitor (also, see
Key Metric Editor
on page 289).
1
In the
Resource Monitors
portlet, and create a new monitor by right-clicking and selecting
New
.
2
Select the type of monitor from the submenu—for this example, an
Key Metrics
monitor.
3
In the
General
screen, enter a name (Test Key Metrics Monitor), and a polling interval (5
minutes is the default). For this example, check
Retain polled data
and accept the remaining
defaults for checkboxes and the retention policy.
4
Select an entity to monitor by clicking the
Add
button in the top portion of the
Monitor
Options
screen.
5
Select devices on which you want to monitor Key Metrics.
6
Select from the available metrics that appear at the bottom of the screen in Key Metric
Properties by selecting a category with the pick list at the top of the screen, then click on an
Available
metric, and click the right arrow to make it a
Selected
metric.
7
Click
Save
to retain your new Monitor.
Summary of Contents for OpenManage Network Manager
Page 1: ...Dell OpenManage Network Manager version 5 1 Web Client Guide ...
Page 14: ...14 A Note About Performance Preface ...
Page 98: ...98 Schedules Portal Conventions ...
Page 142: ...142 Vendors Key Portlets ...
Page 232: ...232 File Management File Servers ...
Page 242: ...242 Deploy Configuration ...
Page 290: ...290 Key Metric Editor Monitoring Metrics This panel s display depends on the selected device ...
Page 340: ...340 ...
Page 374: ...374 Adaptive CLI Records Archiving Policy Actions and Adaptive CLI ...
Page 380: ...380 Glossary ...
Page 388: ...388 388 Index ...


