


W
WWWWWWWWWWWWWWWWWWWWWWWWWWWWWWWWWWWWWWWWWWWWWWWWWWWWWWWWWWWWWWWWWWWW
IF
GAIN
CC
ON/off
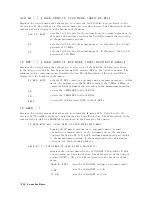
(:DIAG:SERV:CCON:IFG
{OFF|ON|0|1})
T
oggles
the
IF
gain
error
correction
on
and
o.
W
WWWWWWWWWWWWWWWWWWWWWWWWWWWWWWWWWWWWWWWWWWWWWWWWWWWWWWWWWWWWWWWW
SOURCE
CC
ON/off
(:DIAG:SERV:CCON:SOUR
{OFF|ON|0|1})
T
oggles
the
RF
OUT
level
correction
on
and
o.
Note
All
corrections
must
be
turned
to
on
except
when
checking
the
analog
circuits
.
Correction
Constants
The
analyzer
has
the
following
seven
correction
constants
in
the
EEPROM
on
the
A1
CPU
.
It
uses
them
to
control
the
internal
circuits
and
to
achieve
optimum
performance
by
compensating
for
errors
due
to
circuit
characteristics
.
Each
of
the
correction
constants
is
described
below
.
F
or
the
circuits
that
appear
in
the
following
description,
see
the
Theory
of
Operation
chapter
.
Step
Pretune
Correction
Constants
are
control
values
for
the
pretune
D
A
C
in
the
STEP
oscillator
on
the
A5
synthesizer
.
They
are
used
to
control
the
STEP
oscillator
frequency
.
If
these
values
are
not
correct,
the
following
performance
specication
is
severely
degraded:
Frequency
accuracy
at
span
frequency
45
MHz
in
the
network
and
the
spectrum
analyzer
modes
.
RF
OUT
Level
Correction
Constants
are
control
values
for
the
level
D
A
C
and
the
Gain
ALC
in
the
ALC
on
the
A3A1
ALC.
These
aect
the
following
performance
specications:
Source
Level
A
ccuracy/Flatness
in
the
network
analyzer
mode
.
Non-Sweep
P
ower
Linearity
in
the
network
analyzer
mode
.
P
ower
Sweep
Linearity
in
the
network
analyzer
mode
.
Spectrum
Analyzer
Absolute
Magnitude
Correction
Constants
are
equivalent
to
the
frequency
response
of
the
signal
path
used
in
the
spectrum
analyzer
mode
.
These
corrections
are
used
to
compensate
for
errors
due
to
the
frequency
response
in
the
spectrum
analyzer
mode
.
These
are
used
for
the
following
performance
specication:
Frequency
response
in
the
spectrum
analyzer
mode
.
If
these
are
not
correct,
the
following
performance
specications
in
the
spectrum
analyzer
mode
are
severely
degraded:
Displayed
average
noise
level
in
the
spectrum
analyzer
mode
.
Amplitude
delity
in
the
spectrum
analyzer
mode
.
Network
Analyzer
Absolute
Magnitude
Correction
Constants
are
equivalent
to
the
amplitude
frequency
response
of
the
signal
path
used
in
the
network
analyzer
mode
.
These
corrections
are
used
to
compensate
errors
due
to
the
receiver
frequency
response
in
the
network
analyzer
mode
.
They
are
also
used
in
the
spectrum
analyzer
mode
using
one
of
inputs
R,
A,
and
B
.
They
are
for
the
following
performance
specication:
Absolute
amplitude
accuracy
in
the
network
analyzer
mode
.
If
these
correction
constants
are
not
correct,
the
performance
specication
listed
below
is
severely
degraded:
Receiver
noise
level
in
the
network
analyzer
mode
.
Service
K
ey
Menus
10-33
Summary of Contents for Agilent 4396B
Page 10: ......
Page 32: ......
Page 43: ...Figure 2 7 CAL OUT Level Adjustment Location Adjustments and Correction Constants 2 11 ...
Page 46: ...Figure 2 10 Comb Generator Output 2 14 Adjustments and Correction Constants ...
Page 62: ...Figure 2 26 Final Gain Adjustment Location 2 30 Adjustments and Correction Constants ...
Page 76: ...Figure 3 1 Troubleshooting Organization 3 2 T roubleshooting ...
Page 84: ......
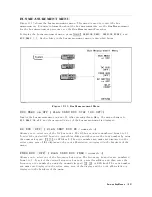
Page 90: ...Figure 5 1 Power Supply Lines Simpli ed Block Diagram 5 2 Power Supply T roubleshooting ...
Page 107: ...Figure 5 12 Power Supply Block Diagram 1 Power Supply T roubleshooting 5 19 ...
Page 108: ...Figure 5 13 Power Supply Block Diagram 2 5 20 Power Supply T roubleshooting ...
Page 109: ...Figure 5 14 Power Supply Block Diagram 3 Power Supply T roubleshooting 5 21 ...
Page 110: ......
Page 112: ...Figure 6 1 Digital Control Group Simpli ed Block Diagram 6 2 Digital Control T roubleshooting ...
Page 124: ......
Page 126: ...Figure 7 1 Source Group Block Diagram 7 2 Source Group T roubleshooting ...
Page 160: ...Figure 8 1 Receiver Group Simpli ed Block Diagram 8 2 Receiver Group T roubleshooting ...
Page 168: ......
Page 184: ...Figure 10 6 External Test Setup 1 Figure 10 7 External Test Setup 2 10 10 Service Key Menus ...
Page 185: ...Figure 10 8 External Test Setup 3 Figure 10 9 External Test Setup 4 Service Key Menus 10 11 ...
Page 226: ...Figure 11 3 Power Supply Functional Group Simpli ed Block Diagram 11 6 Theory of Operation ...
Page 231: ...Figure 11 5 Digital Control Group Simpli ed Block Diagram Theory of Operation 11 11 ...
Page 235: ...Figure 11 6 Source Simpli ed Block Diagram Theory of Operation 11 15 ...
Page 244: ...Figure 11 7 Receiver Simpli ed Block Diagram 11 24 Theory of Operation ...
Page 249: ...Figure IDC5S11001 here Figure 11 8 4396B Source Group Block Diagram Theory of Operation 11 29 ...
Page 254: ...Figure 12 1 Top View Major Assemblies 12 4 Replaceable Parts ...
Page 290: ...Figure 12 36 Main Frame Assembly Parts 17 19 12 40 Replaceable Parts ...
Page 294: ......
Page 308: ......
Page 311: ...Figure C 1 Power Cable Supplied Power Requirement C 3 ...
Page 312: ......
Page 324: ......


