


CHECK
A8
INPUT
A
TTENU
A
TOR
CONTROL
SIGNALS
Use
this
procedure
when
the
A8
input
attenuator
is
the
most
questionable
assembly
.
The
A8
input
attenuator
(0
dB
to
60
dB
,
10
dB
step)
is
used
in
the
spectrum
analyzer
mode
.
A8
attenuates
the
RF
signal
coming
from
the
S
input.
The
attenuated
signal
goes
to
the
A4A2
receiver
RF
.
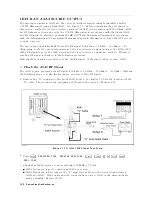
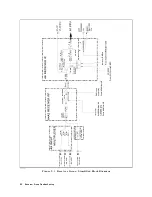
See
the
A8
block
in
Figure
8-1.
A8
is
controlled
by
the
three
signals
at
A8J1,
A8J2,
and
A8J3
(coming
from
the
A2
post-regulator).
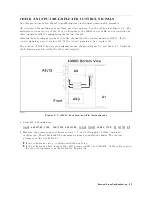
The
locations
of
A8J1,
A8J2,
and
A8J3
are
shown
in
Figure
8-2.
P
erform
the
following
steps
to
verify
the
A8
control
signals
.
If
the
control
signals
are
good,
replace
A8.
If
any
control
signal
is
bad,
replace
A2.
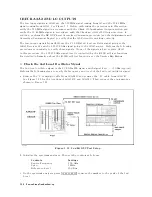
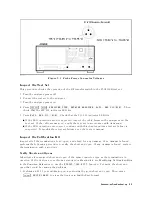
Figure
8-2.
A8
Input
Attenuator
Control
Signals
a.
Press
the
following
keys
.
4
Meas
5 ,
NNNNNNNNNNNNNNNNNNNNNNNNNNNNNNNNNNNNNNNNN
ANALYZER
TYPE
,
NNNNNNNNNNNNNNNNNNNNNNNNNNNNNNNNNNNNNNNNNNNNNNNNNNNNN
SPECTRUM
ANALYZER
,
4
Preset
5 ,
4
Scale
Ref
5 ,
NNNNNNNNNNNNNNNNNNNNNNNNNNNNNNNNNNNNNNNNNNNN
ATTEN
AUTO
man
(then
the
label
changes
to
NNNNNNNNNNNNNNNNNNNNNNNNNNNNNNNNNNNNNNNNNNNN
ATTEN
auto
MAN
)
During
this
procedure
,
A8
is
set
to
10
dB
.
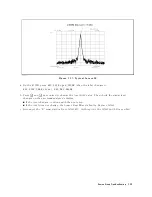
b.
On
the
4396B
,
press
NNNNNNNNNNNNNNNNN
ATTEN
,
NNNNN
0
,
4
x1
5
to
set
A8
to
the
rst
setting
of
0
dB
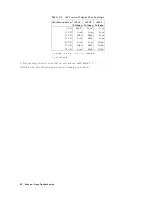
in
T
able
8-2 .
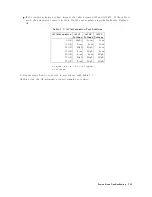
c.
Measure
the
voltage
at
A8J1,
A8J2,
and
A8J3
using
a
voltmeter
.
Then
check
that
the
measured
values
are
within
the
limits
.
The
typical
voltages
are
listed
in
T
able
8-2.
If
the
control
voltages
are
good,
continue
with
the
next
step
.
If
the
control
voltages
are
bad,
inspect
the
cable
between
A8
and
A20J20.
If
the
cable
is
good,
the
attenuator
control
circuit
in
the
A2
post-regulator
is
probably
faulty
.
Replace
A2.
Receiver
Group
T
roubleshooting
8-5
Summary of Contents for Agilent 4396B
Page 10: ......
Page 32: ......
Page 43: ...Figure 2 7 CAL OUT Level Adjustment Location Adjustments and Correction Constants 2 11 ...
Page 46: ...Figure 2 10 Comb Generator Output 2 14 Adjustments and Correction Constants ...
Page 62: ...Figure 2 26 Final Gain Adjustment Location 2 30 Adjustments and Correction Constants ...
Page 76: ...Figure 3 1 Troubleshooting Organization 3 2 T roubleshooting ...
Page 84: ......
Page 90: ...Figure 5 1 Power Supply Lines Simpli ed Block Diagram 5 2 Power Supply T roubleshooting ...
Page 107: ...Figure 5 12 Power Supply Block Diagram 1 Power Supply T roubleshooting 5 19 ...
Page 108: ...Figure 5 13 Power Supply Block Diagram 2 5 20 Power Supply T roubleshooting ...
Page 109: ...Figure 5 14 Power Supply Block Diagram 3 Power Supply T roubleshooting 5 21 ...
Page 110: ......
Page 112: ...Figure 6 1 Digital Control Group Simpli ed Block Diagram 6 2 Digital Control T roubleshooting ...
Page 124: ......
Page 126: ...Figure 7 1 Source Group Block Diagram 7 2 Source Group T roubleshooting ...
Page 160: ...Figure 8 1 Receiver Group Simpli ed Block Diagram 8 2 Receiver Group T roubleshooting ...
Page 168: ......
Page 184: ...Figure 10 6 External Test Setup 1 Figure 10 7 External Test Setup 2 10 10 Service Key Menus ...
Page 185: ...Figure 10 8 External Test Setup 3 Figure 10 9 External Test Setup 4 Service Key Menus 10 11 ...
Page 226: ...Figure 11 3 Power Supply Functional Group Simpli ed Block Diagram 11 6 Theory of Operation ...
Page 231: ...Figure 11 5 Digital Control Group Simpli ed Block Diagram Theory of Operation 11 11 ...
Page 235: ...Figure 11 6 Source Simpli ed Block Diagram Theory of Operation 11 15 ...
Page 244: ...Figure 11 7 Receiver Simpli ed Block Diagram 11 24 Theory of Operation ...
Page 249: ...Figure IDC5S11001 here Figure 11 8 4396B Source Group Block Diagram Theory of Operation 11 29 ...
Page 254: ...Figure 12 1 Top View Major Assemblies 12 4 Replaceable Parts ...
Page 290: ...Figure 12 36 Main Frame Assembly Parts 17 19 12 40 Replaceable Parts ...
Page 294: ......
Page 308: ......
Page 311: ...Figure C 1 Power Cable Supplied Power Requirement C 3 ...
Page 312: ......
Page 324: ......


