


VERIFY
OPERA
TIONS
The
measurement
problem
can
be
caused
by
improper
operation.
Conrm
that
all
operations
,
connections
and
control
settings
,
etc
.,
are
properly
made
during
the
measurement.
F
or
detailed
information
about
proper
operations
,
see
the
following
manuals:
T
ask
R
eference
(p/n
04396-90020)
User's
Guide
(p/n
04396-90021)
Function
R
eference
(p/n
04396-90022)
Programming
Guide
(p/n
04396-90023)
GPIB
Command
R
eference
(p/n
04396-90024)
Some
examples
of
the
typical
operation
errors
are
shown
in
the
following
paragraph.
Using
75
Connectors
with
50
Connectors
Do
not
use
50
connectors
with
75
connectors;
their
center
conductors
are
dierent
diameters
.
Using
a
50
male
connector
with
a
75
female
connector
will
destroy
the
female
connector
.
Large
Spurious
Signals
in
the
Spectrum
Measurement
Large
spurious
signals
around
the
fundamental
signal
can
be
caused
by
an
input
signal
level
that
is
higher
than
the
reference
level.
Reducing
the
input
signal
level
or
setting
the
reference
level
higher
can
solve
the
spurious
signal
problem.
Odd
Appearing
Opens
and
Shorts
in
the
Network
Measurement
Opens
and
shorts
can
appear
as
short
lines
(rather
than
the
expected
points)
on
a
Smith
Chart.
This
is
a
result
of
some
shorts
and
opens
being
oset.
See
the
calibration
kit
manual
to
determine
the
oset.
T
o
verify
the
opens
and
shorts
,
see
V
erify
Shorts
and
Opens
in
the
Inspect
the
Calibration
Kit
procedure
later
in
this
chapter
.
9-2
Accessories
T
roubleshooting
Summary of Contents for Agilent 4396B
Page 10: ......
Page 32: ......
Page 43: ...Figure 2 7 CAL OUT Level Adjustment Location Adjustments and Correction Constants 2 11 ...
Page 46: ...Figure 2 10 Comb Generator Output 2 14 Adjustments and Correction Constants ...
Page 62: ...Figure 2 26 Final Gain Adjustment Location 2 30 Adjustments and Correction Constants ...
Page 76: ...Figure 3 1 Troubleshooting Organization 3 2 T roubleshooting ...
Page 84: ......
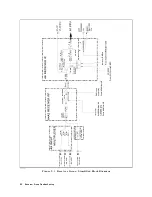
Page 90: ...Figure 5 1 Power Supply Lines Simpli ed Block Diagram 5 2 Power Supply T roubleshooting ...
Page 107: ...Figure 5 12 Power Supply Block Diagram 1 Power Supply T roubleshooting 5 19 ...
Page 108: ...Figure 5 13 Power Supply Block Diagram 2 5 20 Power Supply T roubleshooting ...
Page 109: ...Figure 5 14 Power Supply Block Diagram 3 Power Supply T roubleshooting 5 21 ...
Page 110: ......
Page 112: ...Figure 6 1 Digital Control Group Simpli ed Block Diagram 6 2 Digital Control T roubleshooting ...
Page 124: ......
Page 126: ...Figure 7 1 Source Group Block Diagram 7 2 Source Group T roubleshooting ...
Page 160: ...Figure 8 1 Receiver Group Simpli ed Block Diagram 8 2 Receiver Group T roubleshooting ...
Page 168: ......
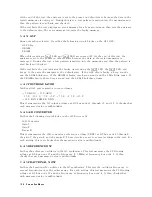
Page 184: ...Figure 10 6 External Test Setup 1 Figure 10 7 External Test Setup 2 10 10 Service Key Menus ...
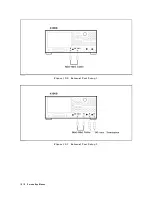
Page 185: ...Figure 10 8 External Test Setup 3 Figure 10 9 External Test Setup 4 Service Key Menus 10 11 ...
Page 226: ...Figure 11 3 Power Supply Functional Group Simpli ed Block Diagram 11 6 Theory of Operation ...
Page 231: ...Figure 11 5 Digital Control Group Simpli ed Block Diagram Theory of Operation 11 11 ...
Page 235: ...Figure 11 6 Source Simpli ed Block Diagram Theory of Operation 11 15 ...
Page 244: ...Figure 11 7 Receiver Simpli ed Block Diagram 11 24 Theory of Operation ...
Page 249: ...Figure IDC5S11001 here Figure 11 8 4396B Source Group Block Diagram Theory of Operation 11 29 ...
Page 254: ...Figure 12 1 Top View Major Assemblies 12 4 Replaceable Parts ...
Page 290: ...Figure 12 36 Main Frame Assembly Parts 17 19 12 40 Replaceable Parts ...
Page 294: ......
Page 308: ......
Page 311: ...Figure C 1 Power Cable Supplied Power Requirement C 3 ...
Page 312: ......
Page 324: ......


