


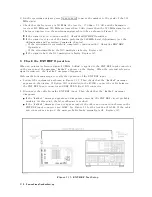


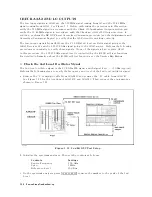

Figure
7-7.
Typical
INT
REF
Signal
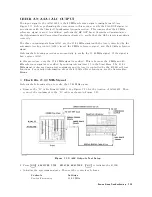
3.
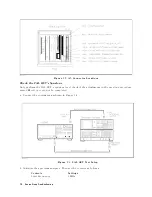
Check
the
FRA
C
N
OSC
Signal
The
fractional
N
oscillator
(FRA
C
N
OSC)
generates
the
signal
for
frequencies
from
31.25
MHz
to
62.5
MHz.
The
signal
level
must
be
+4.25
dBm
6
5
dB
over
the
frequency
range
.
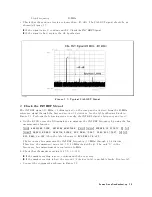
P
erform
the
following
steps
to
verify
the
frequency
and
level
of
the
FRA
C
N
OSC
signal:
a.
Press
4
Meas
5 ,
NNNNNNNNNNNNNNNNNNNNNNNNNNNNNNNNNNNNNNNNN
ANALYZER
TYPE
,
NNNNNNNNNNNNNNNNNNNNNNNNNNNNNNNNNNNNNNNNNNNNNNNNNNNNN
SPECTRUM
ANALYZER
,
4
Preset
5 .
During
this
procedure
,
the
start
and
stop
frequencies
are
set
to
0
Hz
and
1.8
GHz,
respectively
.
These
start
and
stop
settings
sweep
the
FRA
C
N
OSC
frequency
from
32.1653125
MHz
(at
the
start
frequency
0
Hz)
to
60.2903125
MHz
(at
the
stop
frequency
1.8
GHz).
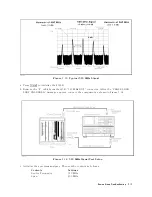
b.
Press
the
following
keys
to
measure
the
FRA
C
N
OSC
frequency
by
using
the
bus
measurement
function:
4
System
5 ,
NNNNNNNNNNNNNNNNNNNNNNNNNNNNNNNNNNNNNN
SERVICE
MENU
,
NNNNNNNNNNNNNNNNNNNNNNNNNNNNNNNNNNNNNNNNN
SERVICE
MODES
,
NNNNNNNNNNNNNNNNNNNNNNNNNNNNNNNNNNNNNNNNNNNN
BUS
MEAS
[OFF]
,
NNNNNNNNNNNNNNNNNNNNNNNNNNNNNNNNNNNNNNNNNNNN
FREQ
BUS
[OFF]
,
4
4
5 ,
4
x1
5 ,
NNNNNNNNNNNNNNNNNNNNNNNNNNNNNNNNNNNNNNNNNNNNNNN
BUS
MEAS
on
OFF
(then
the
label
changes
to
NNNNNNNNNNNNNNNNNNNNNNNNNNNNNNNNNNNNNNNNNNNNNNN
BUS
MEAS
ON
off
)
The
frequency
bus
measures
the
FRA
C
N
OSC
frequency
through
a
1/16
divider
.
Therefore
,
the
measured
value
is
1/16
of
the
actual
frequency
.
F
or
example
,
the
measured
value
at
the
start
frequency
0
Hz
is
2.0103
U
(32.1653125
MHz
divided
by
16).
The
unit
\U"
in
the
frequency
bus
measurement
is
equivalent
to
MHz.
c.
W
ait
for
the
completion
of
the
sweep
.
d.
P
erform
the
following
steps
to
verify
the
frequencies
of
the
FRA
C
N
OSC
signal:
i.
Press
4
Ma
rk
er
5 ,
4
0
5 ,
4
x1
5
to
move
the
marker
to
the
start
frequency
0
Hz.
Then
check
that
the
marker
reading
is
2.0103
U
6
0.01
U
.
ii.
Press
4
Ma
rk
er
5 ,
4
1
5 ,
4
.
5 ,
4
8
5 ,
4
G/n
5
to
move
the
marker
to
the
stop
frequency
1.8
GHz.
Then
check
that
the
marker
reading
is
2.8892
U
6
0.01
U
.
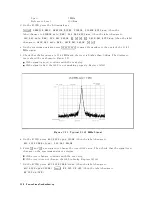
iii.
Check
that
the
displayed
trace
is
straight
(see
Figure
7-8).
If
the
marker
readings
and
the
trace
are
good,
continue
with
the
next
step
.
Source
Group
T
roubleshooting
7-11
Summary of Contents for Agilent 4396B
Page 10: ......
Page 32: ......
Page 43: ...Figure 2 7 CAL OUT Level Adjustment Location Adjustments and Correction Constants 2 11 ...
Page 46: ...Figure 2 10 Comb Generator Output 2 14 Adjustments and Correction Constants ...
Page 62: ...Figure 2 26 Final Gain Adjustment Location 2 30 Adjustments and Correction Constants ...
Page 76: ...Figure 3 1 Troubleshooting Organization 3 2 T roubleshooting ...
Page 84: ......
Page 90: ...Figure 5 1 Power Supply Lines Simpli ed Block Diagram 5 2 Power Supply T roubleshooting ...
Page 107: ...Figure 5 12 Power Supply Block Diagram 1 Power Supply T roubleshooting 5 19 ...
Page 108: ...Figure 5 13 Power Supply Block Diagram 2 5 20 Power Supply T roubleshooting ...
Page 109: ...Figure 5 14 Power Supply Block Diagram 3 Power Supply T roubleshooting 5 21 ...
Page 110: ......
Page 112: ...Figure 6 1 Digital Control Group Simpli ed Block Diagram 6 2 Digital Control T roubleshooting ...
Page 124: ......
Page 126: ...Figure 7 1 Source Group Block Diagram 7 2 Source Group T roubleshooting ...
Page 160: ...Figure 8 1 Receiver Group Simpli ed Block Diagram 8 2 Receiver Group T roubleshooting ...
Page 168: ......
Page 184: ...Figure 10 6 External Test Setup 1 Figure 10 7 External Test Setup 2 10 10 Service Key Menus ...
Page 185: ...Figure 10 8 External Test Setup 3 Figure 10 9 External Test Setup 4 Service Key Menus 10 11 ...
Page 226: ...Figure 11 3 Power Supply Functional Group Simpli ed Block Diagram 11 6 Theory of Operation ...
Page 231: ...Figure 11 5 Digital Control Group Simpli ed Block Diagram Theory of Operation 11 11 ...
Page 235: ...Figure 11 6 Source Simpli ed Block Diagram Theory of Operation 11 15 ...
Page 244: ...Figure 11 7 Receiver Simpli ed Block Diagram 11 24 Theory of Operation ...
Page 249: ...Figure IDC5S11001 here Figure 11 8 4396B Source Group Block Diagram Theory of Operation 11 29 ...
Page 254: ...Figure 12 1 Top View Major Assemblies 12 4 Replaceable Parts ...
Page 290: ...Figure 12 36 Main Frame Assembly Parts 17 19 12 40 Replaceable Parts ...
Page 294: ......
Page 308: ......
Page 311: ...Figure C 1 Power Cable Supplied Power Requirement C 3 ...
Page 312: ......
Page 324: ......


