


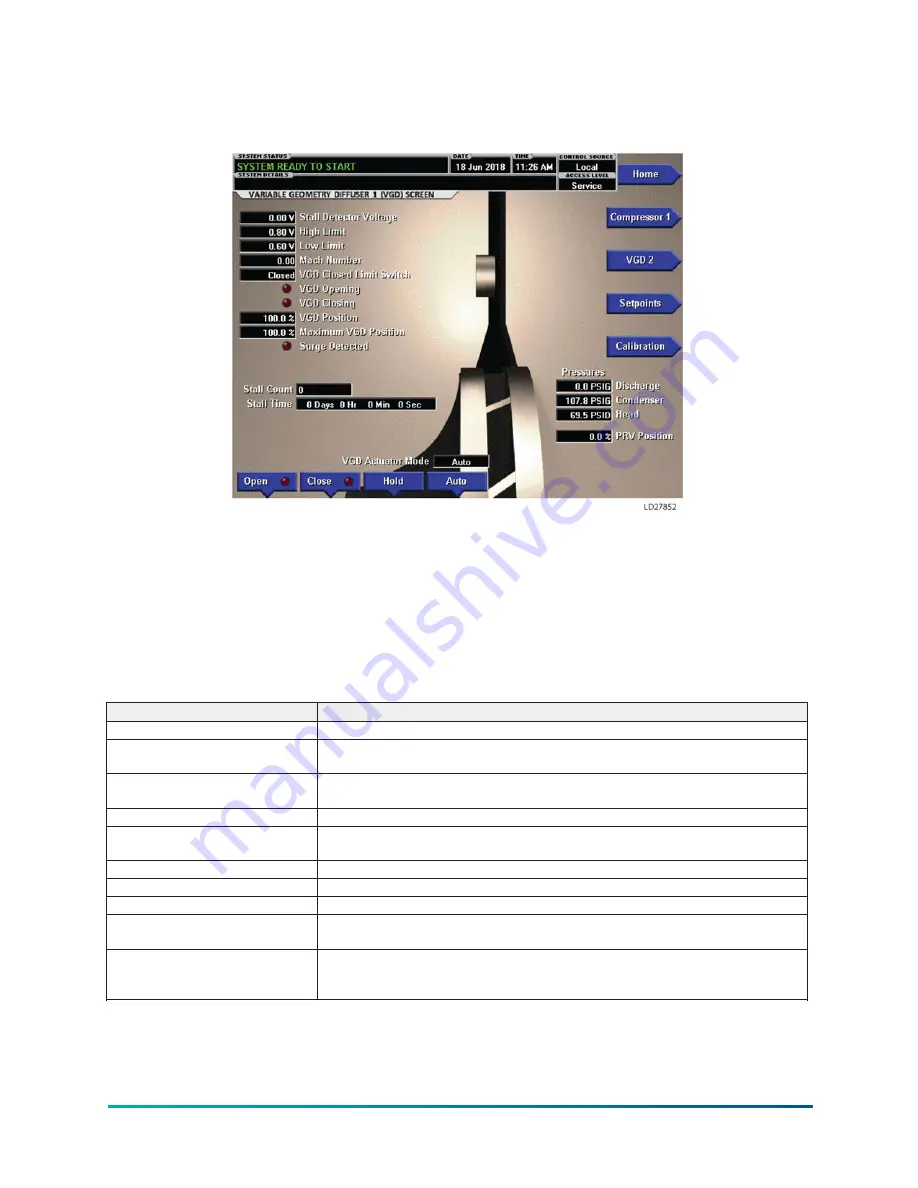
Variable Geometry Diffuser (VGD) screen
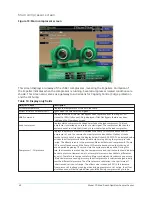
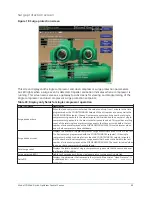
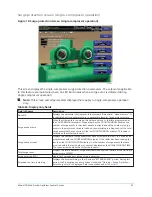
Figure 14: Variable Geometry Diffuser 1 screen
This screen displays information pertinent to the compressor VGD operation. Also, the VGD can be
manually controlled from this screen. Screens for VGD 1 and 2 are similar.
Animations for the diffuser ring are based on the Control Status: Probing – moves right to left
(opening), Stall Reacting or Surge reacting – left to right (closing), all other states – stopped and
shown at a point midway between full left and full right.
Animation for stall detection is shown in the diffuser gap while a stall is occurring (Stall Detector
voltage is above the related High Limit threshold).
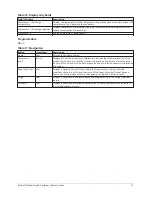
Table 27: Display only fields
Field/LED name
Description
Stall detector voltage
Displays the Stall Detector output voltage (x.xxVDC), as received by the Microboard.
High limit
Displays the High Stall Detector Voltage Limit. Set in the VGD Setpoints Screen with
Service Level Access.
Low limit
Displays the Low Stall Detector Voltage Limit. Set in the VGD Setpoints Screen with
Service Level Access.
Mach number
Displays the speed of the compressor (Mach number = tip speed / speed of sound).
VGD closed limit switch
Displays the status of the VGD Limit Switch. Displayed as CLOSED when the VGD is in
the fully closed position. Otherwise, as OPEN.
VGD opening (LED)
Lights when an open signal is being applied to the VGD.
VGD closing (LED)
Lights when a close signal is being applied to the VGD.
VGD position
Displays the position of the VGD. 0% to 100% open.
Maximum VGD position
Displays the maximum calculated value that the VGD will be allowed to open for the
present condition. (0% to 100%). Opening too far could cause surge.
Surge detected (LED)
Lights momentarily when a surge is detected by the Surge Protection feature. If
equipped with a VSD or MV VSD, these are the surges detected while the drive runs at
maximum frequency.
47
Model YD Mod D with OptiView Control Center
Содержание YD Mod D
Страница 2: ...2 Model YD Mod D with OptiView Control Center...
Страница 8: ...Nomenclature Model YD Mod D with OptiView Control Center 8...
Страница 17: ...Figure 2 Chiller operation flow chart 17 Model YD Mod D with OptiView Control Center...
Страница 18: ...Figure 2 Chiller operation flow chart Model YD Mod D with OptiView Control Center 18...
Страница 19: ...Figure 2 Chiller operation flow chart 19 Model YD Mod D with OptiView Control Center...
Страница 20: ...Figure 2 Chiller operation flow chart Model YD Mod D with OptiView Control Center 20...
Страница 21: ...Figure 2 Chiller operation flow chart 21 Model YD Mod D with OptiView Control Center...
Страница 22: ...Figure 2 Chiller operation flow chart Model YD Mod D with OptiView Control Center 22...
Страница 150: ...Figure 57 Sample printout status Model YD Mod D with OptiView Control Center 150...
Страница 151: ...Figure 57 Sample printout status 151 Model YD Mod D with OptiView Control Center...
Страница 152: ...Figure 58 Sample printout setpoints Model YD Mod D with OptiView Control Center 152...
Страница 153: ...Figure 58 Sample printout setpoints 153 Model YD Mod D with OptiView Control Center...
Страница 154: ...Figure 59 Sample printout schedule Model YD Mod D with OptiView Control Center 154...
Страница 155: ...Figure 60 Sample printout sales order 155 Model YD Mod D with OptiView Control Center...
Страница 156: ...Figure 61 Sample printout history Model YD Mod D with OptiView Control Center 156...
Страница 157: ...Figure 61 Sample printout history 157 Model YD Mod D with OptiView Control Center...
Страница 159: ...Figure 64 Sample printout custom screen report 159 Model YD Mod D with OptiView Control Center...