
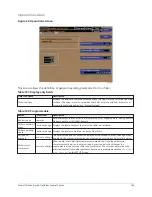


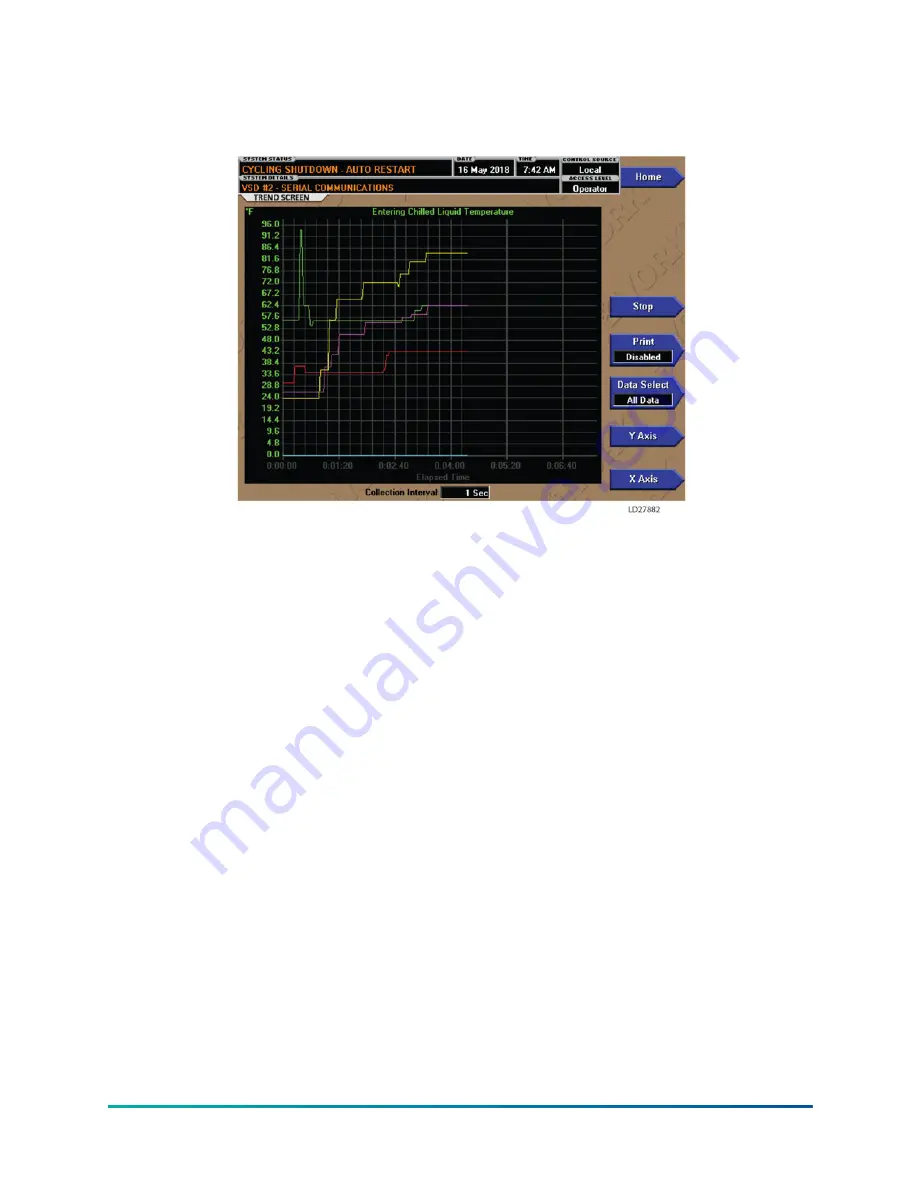
Trend screen
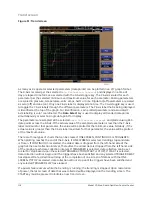
Figure 51: Trend screen
As many as six operator selected parameters (data points) can be plotted in an X/Y graph format.
The X-Axis is scaled per the selected
Data Collection Interval
and displayed in a time of
day or elapsed time format, as selected with the X-Axis toggle key. The Y-Axis is scaled for each
parameter per the selected minimum and maximum value for each parameter. Analog parameters
are scaled in pressure, temperature, volts, amps, hertz or time. Digital on/off parameters are scaled
as zero (off) and one (on). Only one Y-Axis label is displayed at a time. The Y-Axis toggle key is used
to toggle the Y-Axis labels through the different parameters. The Y-Axis label that is being displayed
is identified at the top of the graph. For identification, each plotted parameter and associated Y-
Axis labeling is color coordinated. The
Data Select
key is used to display all trended data points
simultaneously or select a single data point for display.
The parameters are sampled at the selected
Data Collection Interval
and plotted using 450
data points across the X-Axis. If the actual value of the sampled parameter is less than the Y-Axis
label minimum for that parameter, the value will be plotted at the minimum value. Similarly, if the
actual value is greater than the Y-Axis label maximum for that parameter, the value will be plotted
at the maximum value.
There are three types of charts that can be created: ONE SCREEN, CONTINUOUS or TRIGGERED.
When plotting reaches the end of the X-Axis, if ONE SCREEN is selected, trending stops and data
is frozen. If CONTINUOUS is selected, the oldest data is dropped from the left-hand side of the
graph at the next collection interval. Thereafter, the oldest data is dropped from the left hand-side
of the graph at each data collection interval. If TRIGGERED is selected, data collection can be set
to start or stop based upon the selected TRIGGER ACTION (START or STOP). If START is selected,
data collection will not begin until the triggers have been satisfied and any selected TRIGGER DELAY
has elapsed. Data collection will stop at the completion of one screen of data as with the ONE
SCREEN. If STOP is selected, data collection will not stop until the triggers have been satisfied and
any selected TRIGGER DELAY has elapsed.
If a power failure occurs while the trending is running, the trending is stopped. Upon restoration
of power, the last screen of data that was collected will be displayed on the trending screen. The
START key must be pressed to initiate a new trend screen.
Model YD Mod D with OptiView Control Center
118
Содержание YD Mod D
Страница 2: ...2 Model YD Mod D with OptiView Control Center...
Страница 8: ...Nomenclature Model YD Mod D with OptiView Control Center 8...
Страница 17: ...Figure 2 Chiller operation flow chart 17 Model YD Mod D with OptiView Control Center...
Страница 18: ...Figure 2 Chiller operation flow chart Model YD Mod D with OptiView Control Center 18...
Страница 19: ...Figure 2 Chiller operation flow chart 19 Model YD Mod D with OptiView Control Center...
Страница 20: ...Figure 2 Chiller operation flow chart Model YD Mod D with OptiView Control Center 20...
Страница 21: ...Figure 2 Chiller operation flow chart 21 Model YD Mod D with OptiView Control Center...
Страница 22: ...Figure 2 Chiller operation flow chart Model YD Mod D with OptiView Control Center 22...
Страница 150: ...Figure 57 Sample printout status Model YD Mod D with OptiView Control Center 150...
Страница 151: ...Figure 57 Sample printout status 151 Model YD Mod D with OptiView Control Center...
Страница 152: ...Figure 58 Sample printout setpoints Model YD Mod D with OptiView Control Center 152...
Страница 153: ...Figure 58 Sample printout setpoints 153 Model YD Mod D with OptiView Control Center...
Страница 154: ...Figure 59 Sample printout schedule Model YD Mod D with OptiView Control Center 154...
Страница 155: ...Figure 60 Sample printout sales order 155 Model YD Mod D with OptiView Control Center...
Страница 156: ...Figure 61 Sample printout history Model YD Mod D with OptiView Control Center 156...
Страница 157: ...Figure 61 Sample printout history 157 Model YD Mod D with OptiView Control Center...
Страница 159: ...Figure 64 Sample printout custom screen report 159 Model YD Mod D with OptiView Control Center...