


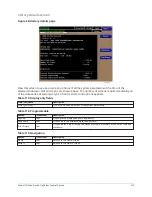


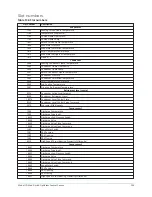


Table 129: Programmable
Button
Access
level
Description
Collection
interval
Operator
Select the desired Data Collection Interval as follows:
1. Determine the desired time interval (in seconds), between data samples.
2. Calculate the full screen time display as follows:
•
450 x Data Collection Interval = full screen seconds
•
Full screen seconds / 60 = full screen minutes
•
Full screen minutes / 60 = full screen hours
•
Full screen hours / 24 = full screen days
3. Decide if the resultant sample interval and full screen display meet the requirements. If not,
select a different sample interval.
Data point
slot # (1-6) Operator
Use the SELECT key as described above and enter the slot number from the Common Slots Screen
or Master Slot Number List of the desired parameter to be trended. The selected parameter
description will be displayed for the Data Point. Setting this slot number to zero will disable
trending for that particular Data Point. Any or all points can be disabled.
Data point
min (1-6)
Operator
Only displayed if the Associated Slot Number is not Zero. This is the minimum value displayed for
the Y-Axis. Selecting a parameter for a Data Point sets this to the default value, which is the lowest
value allowed for that parameter. It can be changed to a value that provides a more appropriate
resolution for the parameter being monitored. To change, use the SELECT key as described above
and enter the desired value.
The value must always be set to a value less than the Data Point Max. Otherwise, a red graph
is displayed on the Trend Screen with the words
TREND MAX MUST BE > TREND MIN
. If the
parameter selected for this data point is a digital type (on/off), this value must be set to zero (0).
Zero indicates the OFF state.
Data point
max (1-6) Operator
Only displayed if the associated slot number is not zero. This is the maximum value displayed for
the Y-Axis. Selecting a parameter for a Data Point sets this to the default value, which is the highest
value allowed for that parameter. It can be changed to a value that provides a more appropriate
resolution for the parameter being monitored. To change, use the SELECT key as described above
and enter the desired value.
The value must always be set to a value greater than the Data Point Min. Otherwise, a red graph
is displayed on the Trend Screen with the words
TREND MAX MUST BE > TREND MIN
. There are
20 Y-Axis divisions. If a MIN-MAX span is selected that is not evenly divided by 20, the Program
will automatically select the next higher MAX value that makes the span evenly divided by 20. For
example, if 0.0 is selected as the MIN and 69.0 is selected as the MAX, the Program will insert 70.0
as the MAX value. If the parameter selected for this data point is a digital type (on/off), this value
must be set to one (1). One indicates the on state.
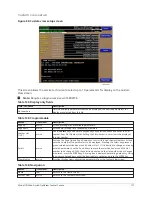
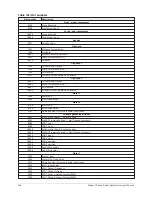
Table 130: Navigation
Button
Access level
Description
Home
View
Returns to the Home screen.
Trending
View
Returns to the Trending screen.
Slot numbers
View
Displays a subscreen that lists the slot numbers of the most commonly monitored
parameters. The desired parameters to be plotted are selected from this screen.
Triggers
View
Displays the Advanced Trend Setup Screen, where the start/stop Triggers can be
setup. Only displayed if TRIGGERED has been selected as Chart Type.
121
Model YD Mod D with OptiView Control Center
Содержание YD Mod D
Страница 2: ...2 Model YD Mod D with OptiView Control Center...
Страница 8: ...Nomenclature Model YD Mod D with OptiView Control Center 8...
Страница 17: ...Figure 2 Chiller operation flow chart 17 Model YD Mod D with OptiView Control Center...
Страница 18: ...Figure 2 Chiller operation flow chart Model YD Mod D with OptiView Control Center 18...
Страница 19: ...Figure 2 Chiller operation flow chart 19 Model YD Mod D with OptiView Control Center...
Страница 20: ...Figure 2 Chiller operation flow chart Model YD Mod D with OptiView Control Center 20...
Страница 21: ...Figure 2 Chiller operation flow chart 21 Model YD Mod D with OptiView Control Center...
Страница 22: ...Figure 2 Chiller operation flow chart Model YD Mod D with OptiView Control Center 22...
Страница 150: ...Figure 57 Sample printout status Model YD Mod D with OptiView Control Center 150...
Страница 151: ...Figure 57 Sample printout status 151 Model YD Mod D with OptiView Control Center...
Страница 152: ...Figure 58 Sample printout setpoints Model YD Mod D with OptiView Control Center 152...
Страница 153: ...Figure 58 Sample printout setpoints 153 Model YD Mod D with OptiView Control Center...
Страница 154: ...Figure 59 Sample printout schedule Model YD Mod D with OptiView Control Center 154...
Страница 155: ...Figure 60 Sample printout sales order 155 Model YD Mod D with OptiView Control Center...
Страница 156: ...Figure 61 Sample printout history Model YD Mod D with OptiView Control Center 156...
Страница 157: ...Figure 61 Sample printout history 157 Model YD Mod D with OptiView Control Center...
Страница 159: ...Figure 64 Sample printout custom screen report 159 Model YD Mod D with OptiView Control Center...