APPLIED OPERATIONS
/Image Processing
OPERATION INSTRUCTIONS
2 - 2 4 8
Page
2 Thresholds Mode
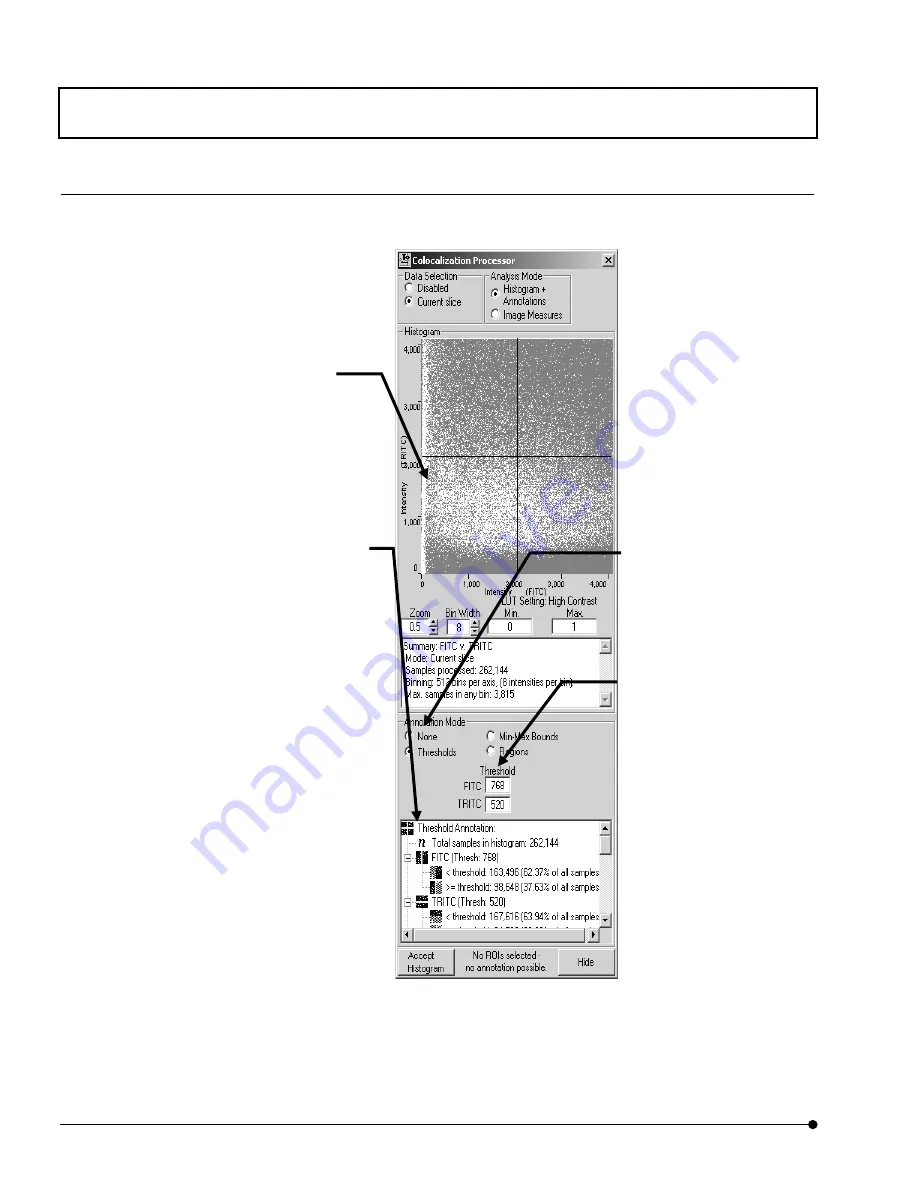
Specifies Threshold level on [Histogram] graph, then measures by use of the threshold level.
Fig. 2-97 [Colocalization Processor] Dialog Box
In case of Annotation Mode is [Threshold]
.
[Histogram] Graph
Threshold line vertical and
horizontal red line) appears. The
value can be adjust by dragging
those lines.
[Threshold] Text Box
Threshold values of X and
Y axis are displayed on
[Histogram] graph. It can
also be input from the
keyboard
The value entered will be
automatically changed to
the value that can be
processed in software.
[Annotation] Text Box
For details, refer to the explanation that appears
in next page.
[Annotation mode] Group
Box
When <Thresholds> option
button is selected, this
dialog box appears.
Содержание Fluoview FV1000
Страница 2: ......
Страница 12: ......
Страница 22: ......
Страница 356: ......
Страница 397: ...APPLIED OPERATIONS Viewing 3D Image OPERATION INSTRUCTIONS 2 3 1 3 Page Fig 2 130 Panel Showing Stereo 3D Images...
Страница 446: ......
Страница 452: ......
Страница 464: ......
Страница 476: ......
Страница 482: ......
Страница 484: ......
Страница 486: ......
Страница 524: ......
Страница 534: ......
Страница 536: ......
Страница 539: ......


