136
3. FUNCTION
3.4 Graph
NOTE
• The trace data stays at "0" for unsupported virtual network terminals although the terminal names are displayed.
• The layout of excel files can be changed by editing the template file "Charts.xltx".
(An editable file can be found in C:\FREQROL\FRC2\dat\com\ChartTemplate.)
• Do not delete objects in the template file "Charts.xltx" or the file itself. Using a template file in which the original template has
been deleted will cause the error message "Export to Excel failed" to be displayed. appears.
A template file used to export data to Excel when an error occurs can be found in the Configurator2 installation folder.
(If the location of the installation folder has not been changed, it can be found in
C:\ProgramFiles\MELSOFT\FRC2\sys\Function\ChartTemplate.) Do not overwrite the template file. Instead, copy the
template file and use that file to make any changes.
3.4.3
Sampling settings
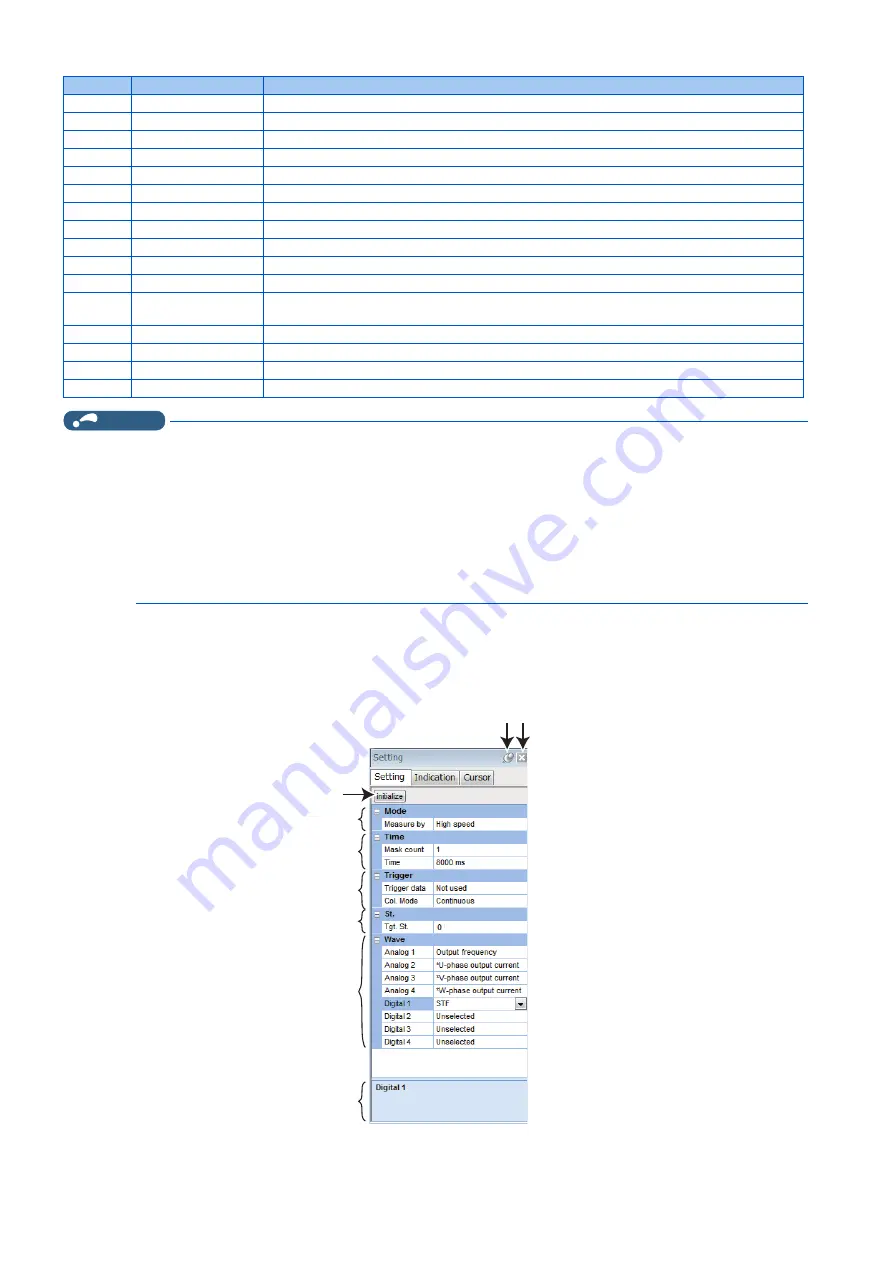
The sampling settings column can be shown by selecting the [Setting] tab in the property conditions. The time, trigger, station,
and waveform of the analog CH can be set as analog data, and that of the digital CH can be set as digital data.
Symbol
Name
Function/description
A
Open
Opens a file (*.gp4, *.st1).
B
Import
Imports a file (*.gp4, *.st1). Use to overlay and compare with previously acquired waveform data.
C
Save as
Saves the file with a different name (*.gp4, *.csv).
D
Save image
Saves the graph screen as image data (*.jpg, *.emf).
E
Export to Excel
Divides the information displayed in the graph window into channels and saves it in Excel format.
F
History management
Switches between show/hide of the waveform history window.
G
Select history
Shows the history number of the displayed graph window.
H
Back
Changes the order of history numbers displayed in the graph window to ascending.
I
Next
Changes the order of history numbers displayed in the graph window to descending.
J
Overwrite
Switches overlaying of the entire history ON/OFF.
K
Screen copy
Saves the entire sub window to the clipboard as image data (*.bmp).
L
Scale optimization
In order to fit all of the waveform of the selected history within the window, the scale and 0-point
position of the drawn waveform's vertical axis are automatically adjusted.
M
Grayout
Changes the display color of the waveform and the display area of the graph (color/gray).
N
Cursor
Switches between show/hide of the screen cursor.
O
Zoom-in mode
Specifies a range of the waveform, and zooms in.
P
Moving mode
Scrolls the waveform data being displayed.
A
H I
B
C
D
E
G
F
Содержание MELSOFT FR Configurator2
Страница 7: ...6 MEMO ...
Страница 212: ...211 3 FUNCTION 3 15 Help 1 2 3 4 5 6 7 8 9 10 ...
Страница 213: ...212 3 FUNCTION 3 15 Help ...
Страница 214: ...213 CHAPTER 4 CHAPTER 4 4 5 6 7 8 9 10 TROUBLE INDICATION 4 1 Error code 214 ...


