X90 mobile modules
256
X90 mobile system User's manual V 1.20 - Translation of the original manual
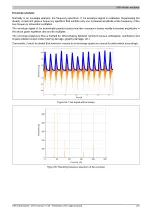
Possible approaches to measuring in a dynamic system
•
Best solution:
Adopting separate measurements for trend analysis where the speed can be kept constant
for the duration of measuring.
•
If a measurement cannot be taken at constant speed, an assessment of the machine condition can be made
using the characteristic values or a broadband frequency (in this example, this would be 80 to 220 Hz).
5.4.1.6.3 Practical applications of damage recognition
It is possible to gain good insight into the condition of a machine or system by measuring the parameters associ-
ated with errors. This parameter data is used by different algorithms in the module to calculate the characteristic
values. This method of forming characteristic values occurs continually and automatically. It requires little technical
knowledge and is easy to use and implement. It is an easy way to check a machine for damage and error states.
Selecting suitable characteristic values and assessing them over a longer time frame is the basis for effective and
successful monitoring of a machine, a process known as "trending". It enables multiple aggregates to be monitored
with a relatively low need for technical measuring and a low demand on staff.
Simply setting basic limits as a warning is not enough. Instead, logical correlations with other parameters such as
load or speed, or even the shape of the trend curve, are also required.
Characteristic values are thus gathered in the trend curve and compared with norms or values taken from available
experience over a long period of time. This trend progression can be used to make a good assessment of the
machine's condition. The way these factors change over time indicates whether the condition is worsening, i.e. if
damage is beginning to occur.
Recording the measured values in a diagram over a longer period of time shows the status of the characteristic
values at the defined warning and alarm thresholds. If these thresholds are exceeded oscillation diagnostics gives
the cause of the error so that appropriate maintenance measures can be taken.
Example: Trend curve for a characteristic value
February
March
April
May
June
July
Characteristic
value
Alarm limit
Warning limit


