X90 mobile modules
230
X90 mobile system User's manual V 1.20 - Translation of the original manual
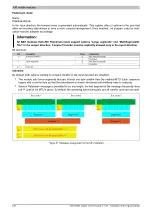
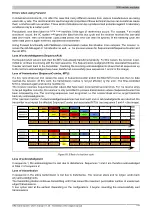
Bathtub / Deterioration curve
The operating performance of every mechanical component changes over the course of operation, with each
component becoming defective at some point. It is crucial to recognize such a change before the component can
no longer fulfill its function. This behavior can be illustrated very well by the so-called "bathtub curve". This indicates
the probable failure rate over time.
Early failures
Wear and
fatigue failures
Chance failures
Oscillation level
Lifetime calculation
Tests, experience
Correct operation and servicing,
adequate deployment
Tests,
production faults,
quality of installation
Time
New machine
Running-in time
Planned
Servicing time
Repairs
necessary
Repairs done
Failure
Figure 61: Bathtub curve illustrating the 3 typical phases
Each component is subject to the regularities of this curve, with a typical trend emerging as a result.
•
Area 1 (early failures)
is characterized by a decreasing failure rate. Early failures are caused almost
exclusively by errors in assembly or construction. However, special care and quality during production and
commissioning significantly reduces the failure rate at the beginning. This area also explains the increased
failure performance after an intervention in a system that functions well.
•
During continuous operation in
Area 2 (chance failures)
, the failure rate is almost consistent. These
chance failures are fundamentally difficult to ascertain and, most importantly, not easily influenced. Oper-
ating and maintenance errors contribute towards an increase in the failure rate in this region.
•
The failure rate increases dramatically in
Area 3 (wear and failure due to fatigue)
. Wear and fatigue
failures are primarily characterized by damage that progresses slowly over time.
The trend provides valuable information about the failure probability of the parameters measured by condition
monitoring. This usually behaves like the bathtub curve, i.e. an increase in the characteristic value signifies a
change in the system. The characteristic values can be synchronized with the operating parameters through the
integration of automation technology. Assessing curve performance and incorporating operating parameters makes
it possible to identify the best time to perform service work depending on condition.
In addition, oscillations are often representative of the condition of a machine or component. They are a good
indication of wear or damage. One example of this is roller bearings. Surface damage (pitting) leads to increased
oscillations in the bearing housing. These can be measured and evaluated. An increase in oscillations during
operation indicates damage and/or increased wear. By constantly observing this condition, deviations from normal
operation can be recognized immediately.

