20. Appendix: Pre-configured curves
20.1 Overview
20.1.1 Introduction
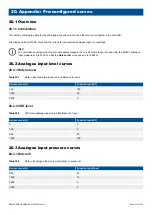
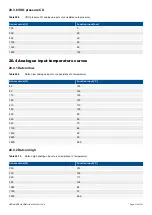
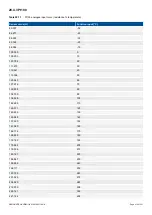
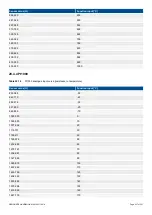
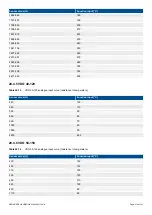
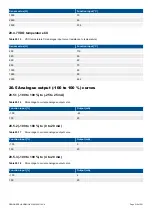
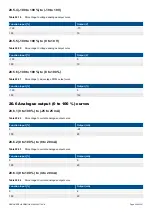
This section contains the data for the analogue input and output curves that are pre-configured in the controller.
The display unit and PICUS only show the curves for the selected analogue input or output type.
INFO
The controller's analogue input cannot necessarily measure the curve's whole range. For example, the EIM3.1 analogue
input measures up to 2500 Ω, while the
Datcon low
curve goes up to 19890 Ω.
20.2 Analogue input level curves
20.2.1 Datcon level
Table 20.1
Datcon level analogue input curve (resistance to level)
Sensor value (Ω)
Function input [%]
335
100
1030
50
2400
0
20.2.2 VDO level
Table 20.2
VDO level analogue input curve (resistance to level)
Sensor value (Ω)
Function input [%]
0
0
100
0
960
50
1800
100
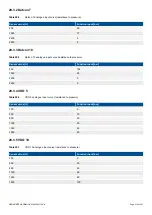
20.3 Analogue input pressure curves
20.3.1 Datcon 5
Table 20.3
Datcon 5 analogue input curve (resistance to pressure)
Sensor value (Ω)
Function input [bar]
335
55
1530
14
2400
0
2500
0
DESIGNER'S HANDBOOK 4189340911K UK
Page 513 of 521

