


Running interactive activities
133
3.
Click
Edit > Hide
or click
Hide
.
The Activity Center tool dims and italicizes the equation.
4.
Click a blank portion of the Equation Gallery to deselect the
equation.
The equation’s graph no longer appears in the window.
Showing and hiding points in the graph
The points you collect or create appear both in data sets and in the
graph. When you discuss points, you may want to show or hide the
certain points in the graph. You can hide or show points in the graph
under the List - Graph tab. Any changes you make to the points are
reflected under all of the tabs with graphs.
Note:
By default, the Activity Center tool shows the points created or
contributed in plots.
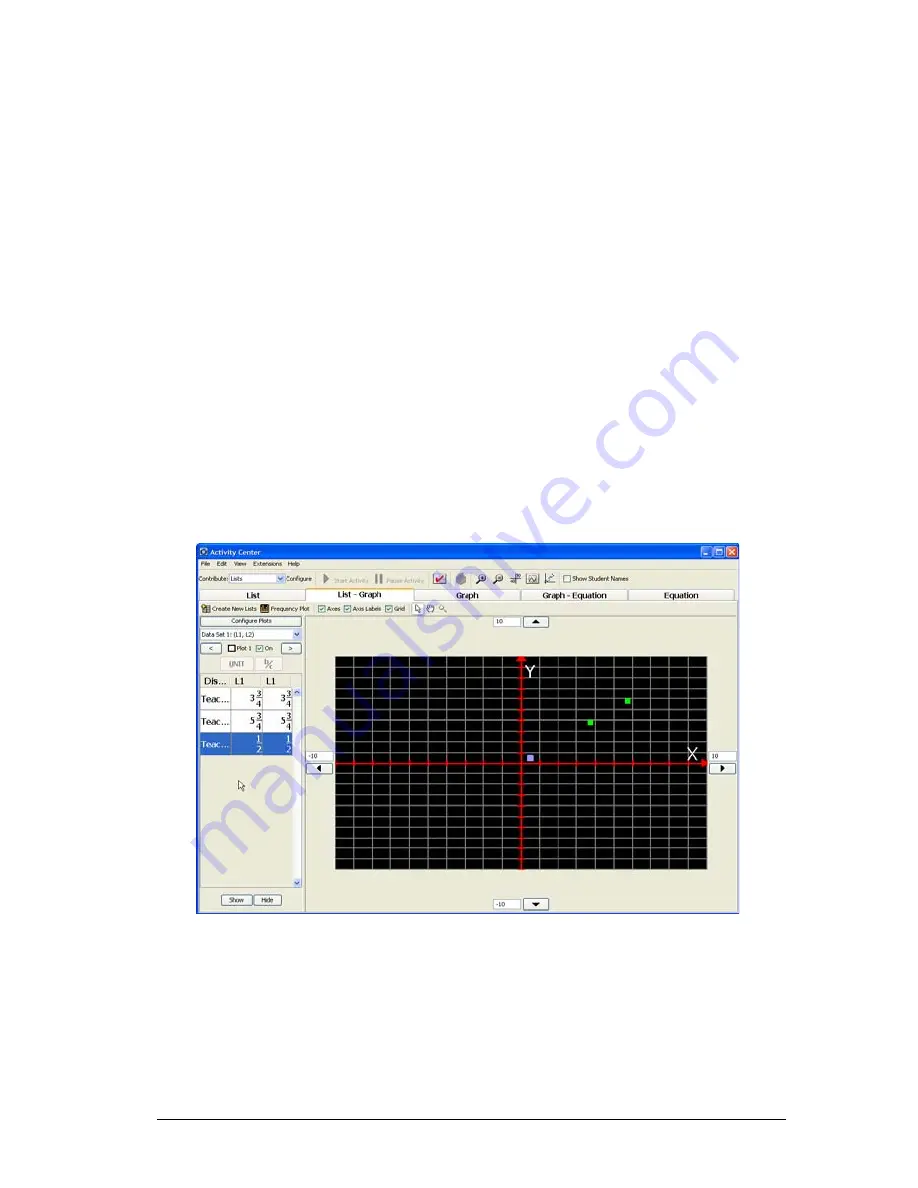
To show points in the graph
1.
Click the
List - Graph
tab.
The List - Graph tab opens.
2.
Click the hidden point you want to show. The coordinates of the
hidden points are dimmed and italic.
Note:
To select multiple points, press and hold the Ctrl key and click
the points you wish to select. You can also click and drag the cursor
to select all the points in a region. Press and hold the Ctrl key and
click to deselect points.
Summary of Contents for Navigator
Page 1: ...TI Navigator Reference Guide ...
Page 46: ...40 Managing student accounts ...
Page 64: ...58 Exchanging files with students ...
Page 145: ...Running interactive activities 139 ...
Page 146: ...140 Running interactive activities ...
Page 158: ...152 Polling students ...
Page 164: ...158 Capturing calculator screens ...
Page 167: ...LearningCheck Creator 161 ...
Page 254: ...248 The Class Analysis Tool ...
Page 259: ...Installing Apps and OS files 253 ...
Page 260: ...254 Installing Apps and OS files ...
Page 278: ...272 Glossary ...
Page 302: ...296 Legal Information ...
Page 314: ...308 ...


