


116
Running interactive activities
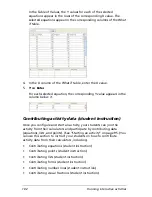
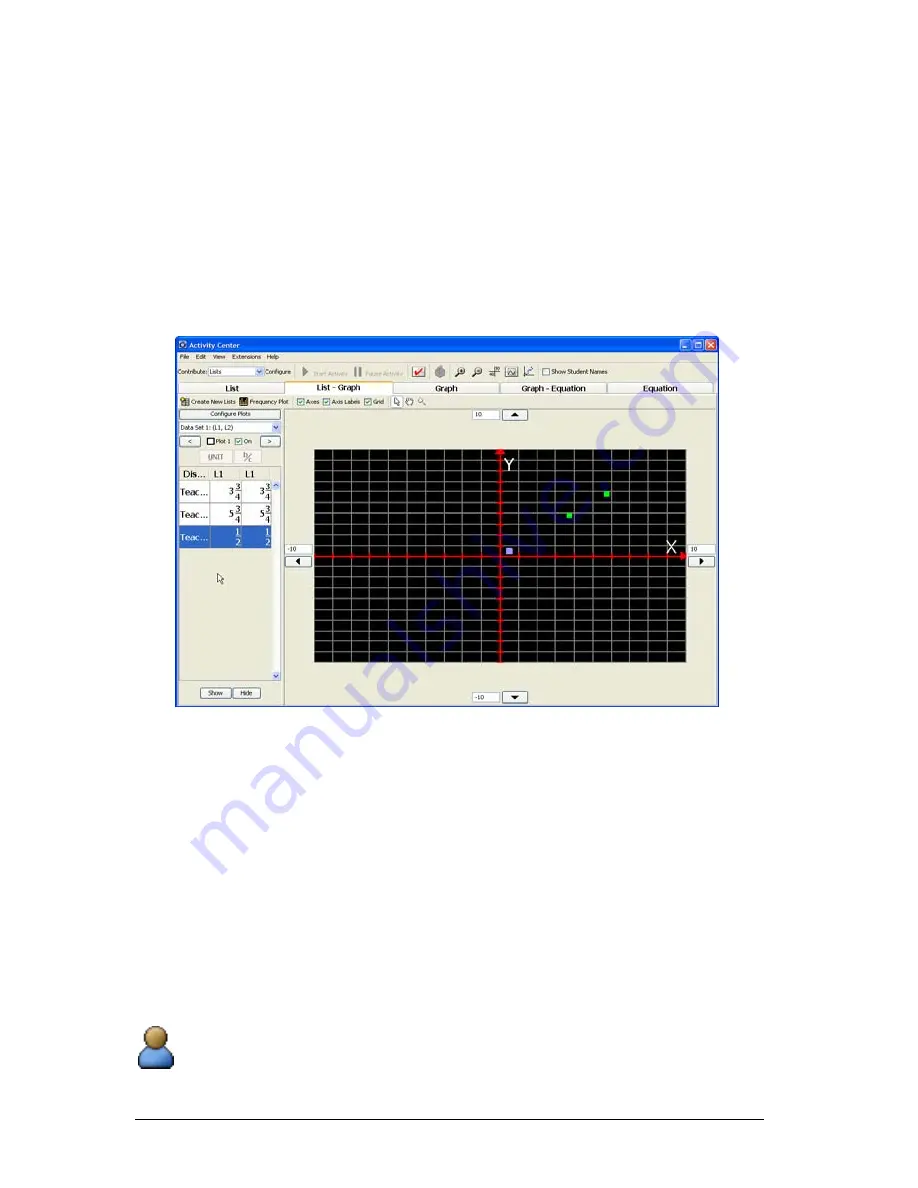
Turning plots on and off
When you discuss the graph with your class, you may want to turn certain
plots on or off. You can turn the plots on or off under the List - Graph
tab. Any changes you make to the plots are reflected under all of the
tabs with graphs.
Note:
By default, the Activity Center tool turns on defined plots.
To turn plots on or off
1.
Click the
List - Graph
tab.
The List - Graph tab opens.
2.
Select the plot you want to turn on or off. (See “Selecting plots” on
page 115.)
3.
Select or clear the
On
check box.
If you select the On check box, the Activity Center tool displays the
plot in the graph.
If you clear the On check box, the Activity Center tool removes the
plot from the graph.
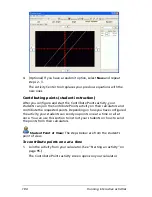
Plotting equations (student instruction)
Depending on how you set up the Contribute Equations activity, your
students can plot the graphs of their own equations on their calculators.
Student Point of View
: The following instructions are from the
student’s point of view.
Summary of Contents for Navigator
Page 1: ...TI Navigator Reference Guide ...
Page 46: ...40 Managing student accounts ...
Page 64: ...58 Exchanging files with students ...
Page 145: ...Running interactive activities 139 ...
Page 146: ...140 Running interactive activities ...
Page 158: ...152 Polling students ...
Page 164: ...158 Capturing calculator screens ...
Page 167: ...LearningCheck Creator 161 ...
Page 254: ...248 The Class Analysis Tool ...
Page 259: ...Installing Apps and OS files 253 ...
Page 260: ...254 Installing Apps and OS files ...
Page 278: ...272 Glossary ...
Page 302: ...296 Legal Information ...
Page 314: ...308 ...


