


9-3
Section
Creating the Sample Data
378
(4) Adjust the position of “Bar Graph 1” character string on the data creation
screen by dragging it.
Creating the bar graph frame
(5) Select [Objects] (menu bar)
→
[Graph]
→
[Bar Graph]. (Refer to
6-9-1 Bar
Graph
.)
(6) Drag the mouse cursor at the position where bar graph 1 is to be displayed
(drag between diagonally opposing corners) to create the frame of [Bar
Graph 1].
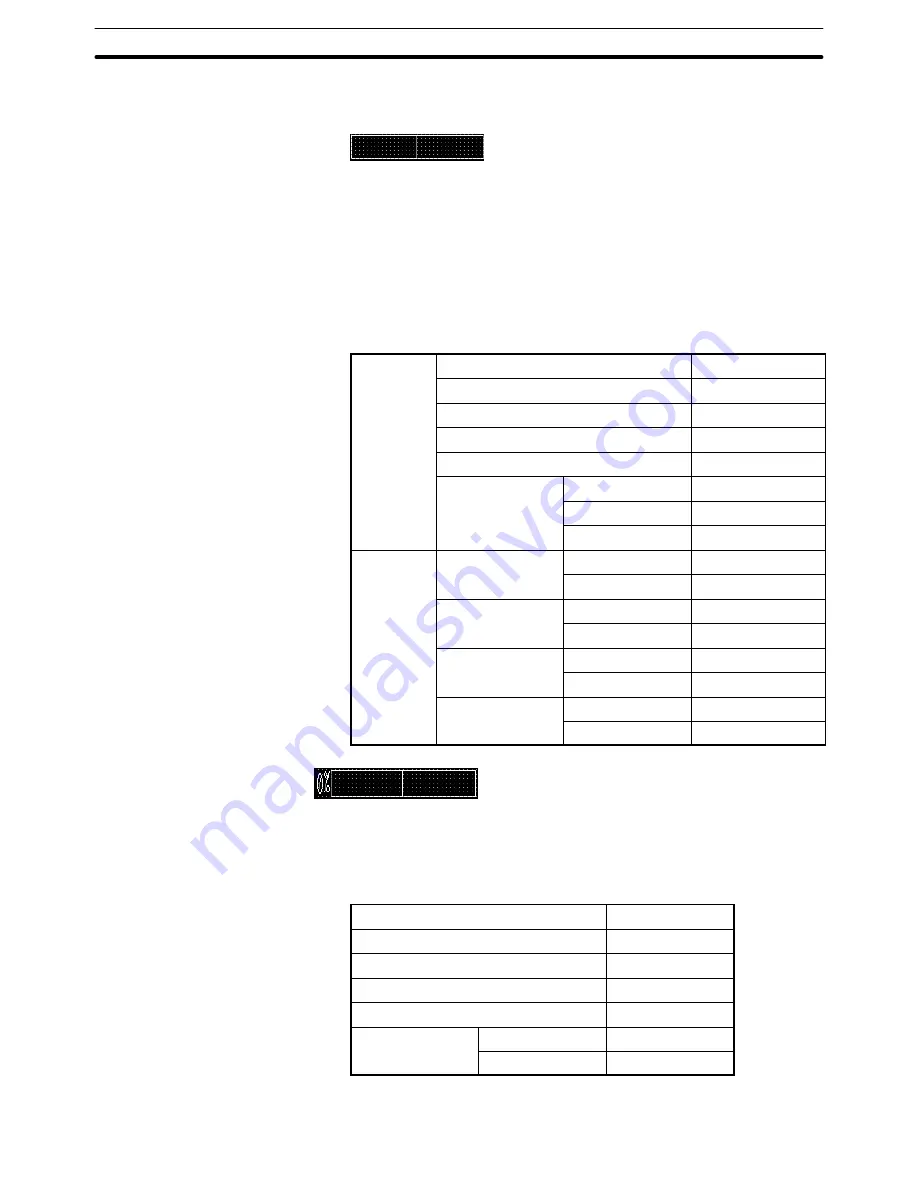
(7) Set the properties as shown below.
General
Position
––
Size
––
Frame
Display Sign
Direction
Right
Color
Frame
White
+ Range
White
– Range
White
Settings
Value
Table Entry
4
Display %
100%
Table Entry
Display %
, 500
0%
Table Entry
Display %
, 0
–100%
Table Entry
Display %
, –500
Setting the % display
(8) After specifying the bar graph, select [Edit] (menu bar)
→
[Edit Object].
(9) Double click on [0%] and set the properties as shown below.
Position
––
Font Type
Standard
Scale
1
2 (High)
Smoothing
Attribute
––
Color
Foreground
White
Background
Black
Adjusting the size and position of bar graph frame and % display
Summary of Contents for NT-SERIES - SUPPORT TOOL FOR WINDOWS V4
Page 1: ...Cat No V061 E1 06 Support Tool for Windows Ver 4 NT Series OPERATION MANUAL...
Page 2: ......
Page 3: ...NT series Support Tool for Windows Ver 4 j Operation Manual Revised July 2010...
Page 4: ...iv...
Page 6: ...vi...
Page 14: ......
Page 80: ......
Page 94: ......
Page 338: ......
Page 422: ......
Page 458: ......
Page 478: ......
Page 502: ......
Page 508: ......
Page 532: ......
Page 556: ......
Page 560: ......
Page 562: ......
Page 564: ......
Page 570: ......
Page 572: ......
Page 584: ......
Page 590: ......
Page 592: ......
Page 593: ......


