125
Segment Program 3 (Block Model 158)
Section 6-19
■
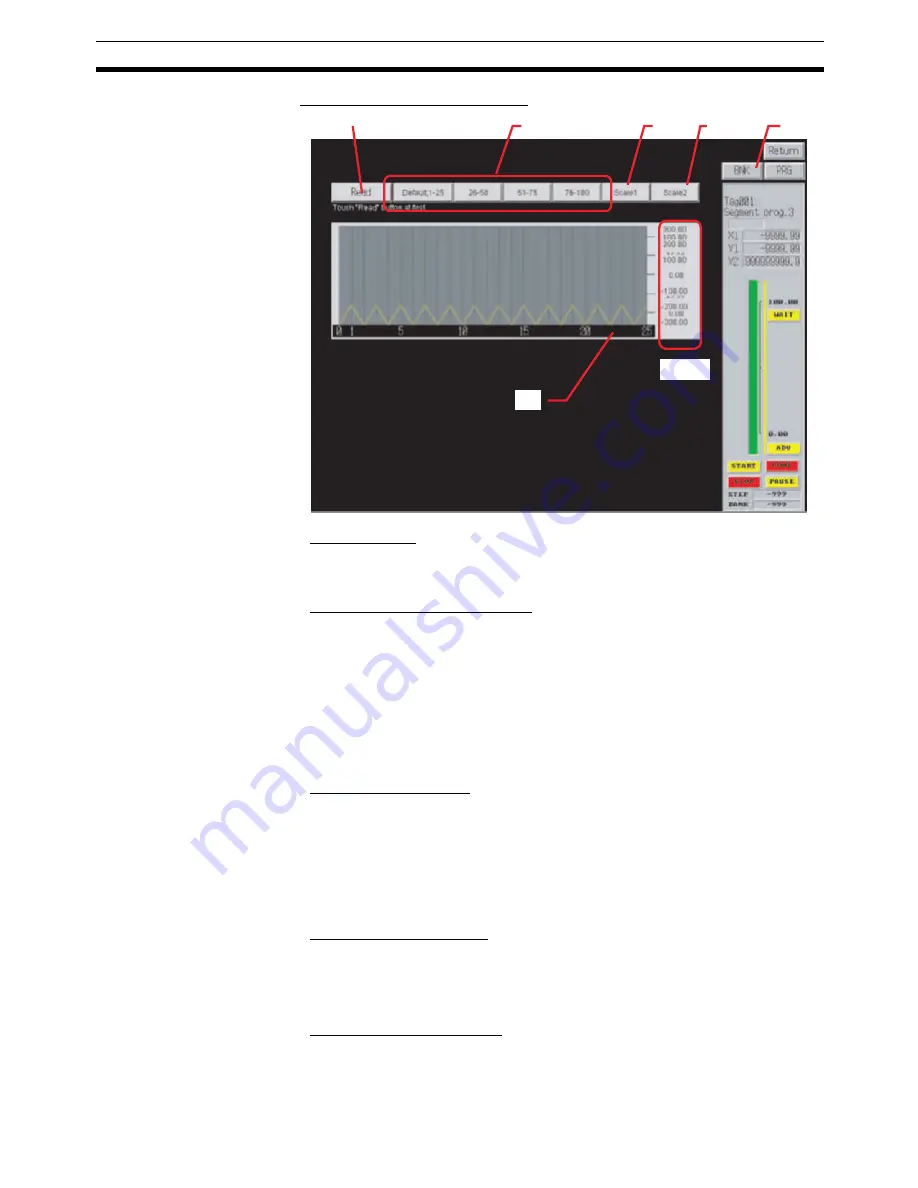
Step Data Graph Display Screen
1: Read Button
This button reads the step data from the Loop Control Board/Unit and displays
it in a graph.
2: Step Data Switching Buttons
These buttons display the step numbers to be displayed in a graph. Up to 25
steps can be displayed in each graph.
Default, 1-25: Displays Default B0 and Steps 1-25
26-50: Displays steps 26 to 50
51-75: Displays steps 51 to 75
76-100: Displays steps 76 to 100
3 and 4: Scale Buttons
These buttons are used to change the scale of the output value axis (i.e.,
scale on the Step Data Graph Display Screen). Using percentage data, either
a
−
300.0 to 300.0 (Scale 1) or a 0 to 100.0 (Scale 2) can be selected. When
using engineering units, the percentage data is converted to, and displayed in,
engineering units based on Segment Program 3 scale data.
5: BNK and PRG Buttons
BNK Button: Opens the Bank Data Setting Screen.
PRG Button: Opens the Step Data Setting Screen.
6: Step Data Graph Display
Displays step data in a graph. The horizontal axis indicates time, and the ver-
tical axis indicates the output value.
1
2
3
4
6
5
Scale
Summary of Contents for Face Plate Auto-Builder for NS 3.1
Page 2: ...WS02 NSFC1 EV3 Face Plate Auto Builder for NS Ver 3 1 Operation Manual Revised December 2007...
Page 3: ...iv...
Page 5: ...vi...
Page 13: ...xiv...
Page 21: ...6 Upgrades Made for Version 3 1 Section 1 6...
Page 27: ...12 Uninstalling the Face Plate Auto Builder for NS Section 2 2...
Page 28: ...13 SECTION 3 Basic Operation Flow 3 1 Basic Operation Flow 14...
Page 39: ...24 Merging Projects Section 4 2...
Page 141: ...126 Segment Program 3 Block Model 158 Section 6 19...
Page 143: ...128 Revision History...


