Chapter 2 MultiLab Software
49
9. Add a Graph to the Project
MultiLab displays new data in the graph window every time you start a new
recording. You can always display previous data using the
Edit graph
dialog box or
by double-clicking on the data
’
s icon in the
Data Map.
If you want to save a graph
that you created to your project, or to update a saved graph with changes you made,
use the
Add to project
tool:
Click
Add to project
on the graph toolbar.
2.4.3.
The Table Display
Click
Table
to display or to remove the table window.
When you start a new recording, MultiLab displays the new data on the table.
To add or remove columns from the table, use the
Edit table
tool (see below).
1. Editing Data Values
You can change the value of any data point. When any value is changed, MultiLab
automatically creates a copy of the data set and leaves the original data unchanged.
To do this:
1. Select a data cell by clicking on it
2. Type in the new value
3. Press
Enter
on the keyboard to accept (you can also press Tab or
the arrow keys to accept and move to the next cell).
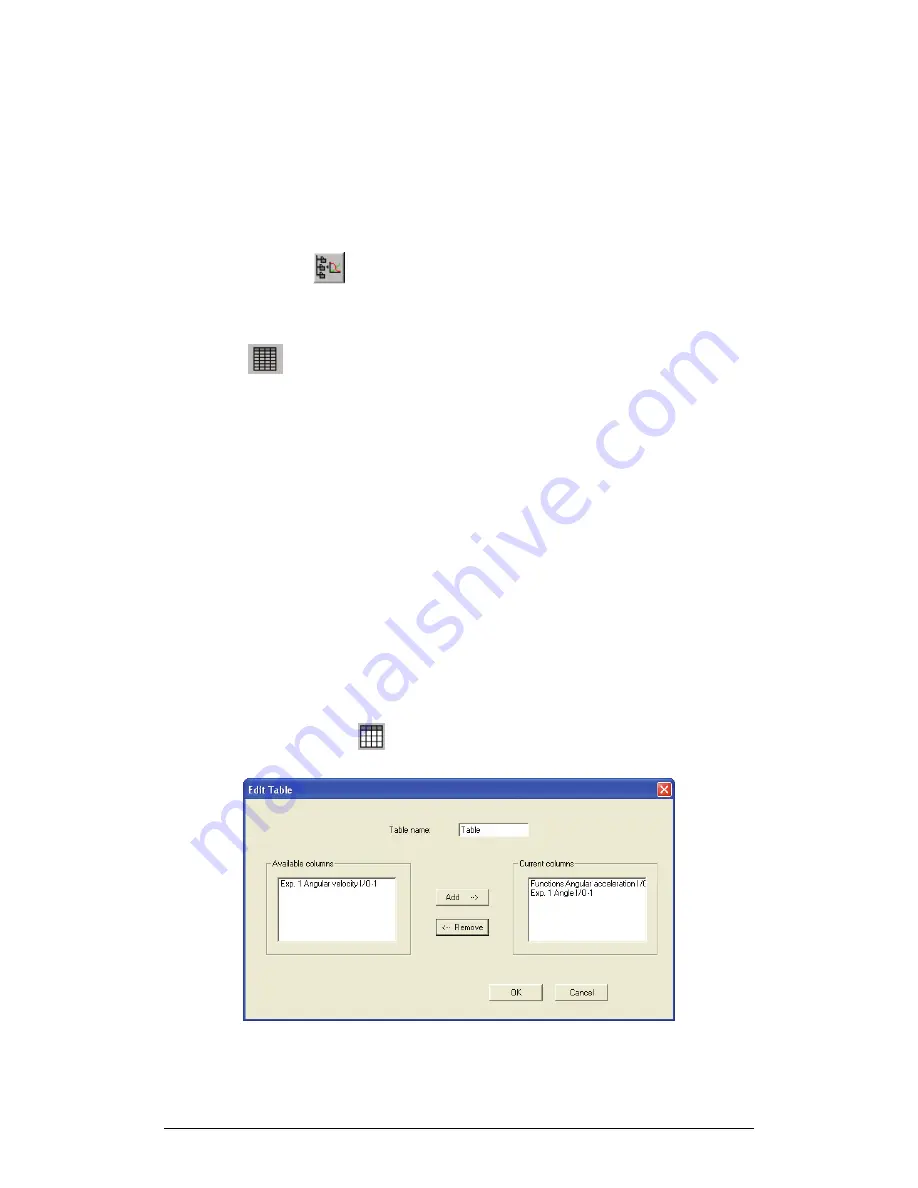
2. Editing the Table
To add or remove data sets from the table:
Click
Edit table
on the table toolbar to open the Edit table dialog
box:
Figure 9: Edit table dialog box
Summary of Contents for MultiLab
Page 2: ...MultiLogPRO User Guide Fourier Systems Eleventh Edition First Print Printed in July 2006...
Page 3: ......
Page 9: ......
Page 117: ...108 Chapter 2 MultiLab Software...
Page 133: ...124 Chapter 3 Working with a TI Calculator...
Page 137: ...128 Chapter 5 Specifications...
Page 145: ...136 Chapter 5 Specifications...


