Chapter 2 MultiLab Software
99
In capture mode, when you start recording, the data in the graph window appears as
it normally does, but every time you click
Capture
, MultiLab enters the most recently
recorded value into a new entry in the capture table.
When you have finished capturing data, you can add manual columns to the table
and display the data in the graph window.
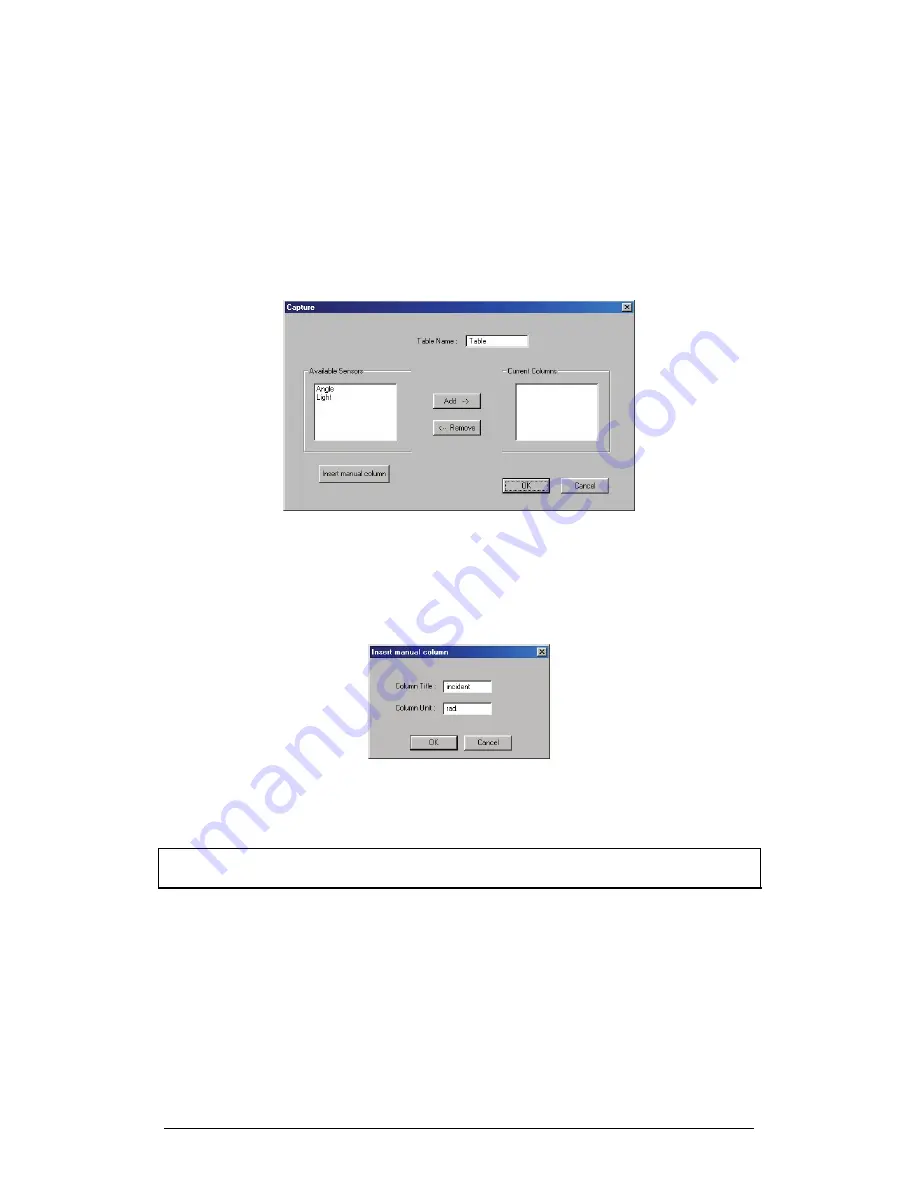
1. Preparing the Capture Table
1. Click
Table
on the menu toolbar, and then click
Capture mode
to
open the Capture dialog box:
Figure 28: Capture dialog box
2. In the
Available Sensors
list, select the sensors you want to
capture by clicking their name and then click
Add
.
3. If you want to insert a manual column into the table, click I
nsert
manual column
to open the dialog box:
Figure 29: Manual Column dialog box
4. Enter the column’s name and unit, then click
OK
.
The new column is added to the Current Columns list.
Note:
You can always add manual columns later by clicking Add manual column on
the Table menu.
5. Click
OK
.
MultiLab opens a new table with the columns you defined.
6. Enter values into the manual column by clicking a cell and typing the
number, then press
Enter
or the down arrow key to move to the next
cell:
Summary of Contents for MultiLab
Page 2: ...MultiLogPRO User Guide Fourier Systems Eleventh Edition First Print Printed in July 2006...
Page 3: ......
Page 9: ......
Page 117: ...108 Chapter 2 MultiLab Software...
Page 133: ...124 Chapter 3 Working with a TI Calculator...
Page 137: ...128 Chapter 5 Specifications...
Page 145: ...136 Chapter 5 Specifications...


