


System monitoring
Page 94
FortiRecorder 2.4.2 Administration Guide
Table 11:
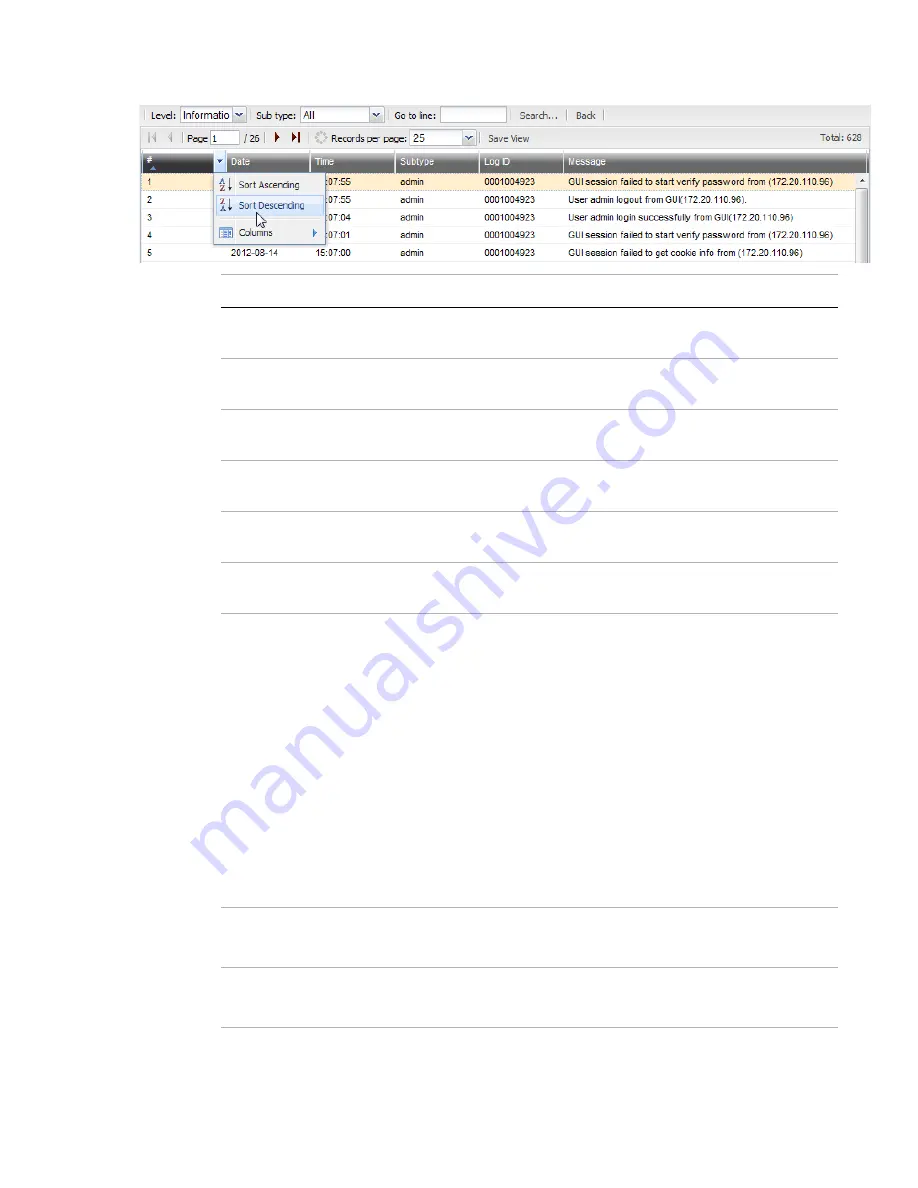
Monitor > Video Monitor > Event
(viewing the contents of a log file)
Setting name
Description
Level
Select a severity level to hide log messages that are below this
threshold (see
Subtype
Select a subcategory (corresponding to the
log messages whose
subtype
field does not match.
Go to line
Type the index number of the log message (corresponding to the
column) that you want to jump to in the display.
Search
Click to find log messages matching specific criteria (see
).
Back
Click to return to the list of log files stored on FortiRecorder’s hard
drive.
Save View
Click to keep your current log view settings for subsequent views and
sessions (see
“Displaying & sorting log columns & rows”
).
#
The index number of the log message within the log file,
not
the order
of rows in the web UI.
By default, the rows are sorted by timestamp in descending order, the
same as they are within the log file, so the rows are in sequential
order, starting with the most recent log message, number 1, in the top
row. If you change the row sorting criteria (see
), these index numbers won’t be in the same
order as the rows.
For example, when sorting by the
column’s contents, the
index numbers of the first 3 rows could be 14, 15, 9.
Note:
In the current log file,
each log’s index number changes
as
new log messages are added, pushing older logs further down the
stack. To find the same log message later, remember its timestamp
and
not
its
Date
The date on which the log message was recorded.
When in raw format, this is the log’s
date
field.
Time
The time at which the log message was recorded.
When in raw format, this is the log’s
time
field.


