Using the QC Programs
8-15
8.3 X-B Analysis
One weakness of quality control using control materials is that the control material is usually
assayed only once a shift. If a significant change in calibration occurs, it might go undetected
for the remainder of the shift. The X-B represents the moving average of hematology values
calculated using an algorithm developed by Dr. Brian Bull. The X-B analysis uses the Bull
algorithm to monitor the performance of the analyzer by tracking the average red cell indices
MCV, MCH, and MCHC on the patient samples run through the instrument in batches of 20.
The Target Value for X-B is similar to the assay value for a commercial control. It is derived
from the patient population analyzed on the instrument. The Limit is the acceptable limit of
variation around the target value.
The X-B analysis demands random samples and therefore, the samples categorized by
diseases are not suitable for its use.
8.3.1 QC Editing
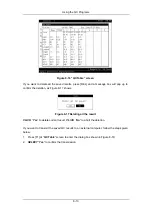
Entering the “X-B Table” screen
Press [MENN] to enter the system menu.
SELECT
“
X-B analysis
” (Figure 8-19), to enter the
“
X-B Table
” screen, as Figure 8-20 shows.
Figure 8-19 System menu
Содержание BC-2800
Страница 1: ...BC 2800 Auto Hematology Analyzer Operator s Manual ...
Страница 2: ......
Страница 12: ......
Страница 24: ...Using This Manual 1 12 Figure 1 4 High voltage warning label 7 High Voltage 7 ...
Страница 62: ......
Страница 91: ...Customizing the Analyzer Software 5 29 Figure 5 46 Saving changes ...
Страница 92: ......
Страница 122: ...Operating Your Analyzer 6 30 z Dispose of reagents waste samples consumables etc according to government regulations ...
Страница 170: ...Using the QC Programs 8 14 Figure 8 18 Transmission dialog box ...
Страница 196: ......
Страница 248: ......
Страница 252: ......
Страница 258: ...Appendices B 6 38 6 cm 32 2 cm 43 7 cm B 13 Weight Less than 23 kg B 14 Contraindications None ...
Страница 266: ......
Страница 284: ...Appendices E 10 Hemoglobin Concentration ...
Страница 286: ...P N 2800 20 28795 2 0 ...


