Reviewing Sample Results
7-28
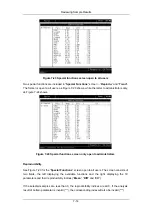
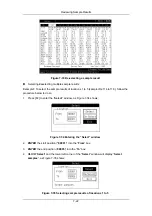
Figure 7-45 “Trend” screen (1)
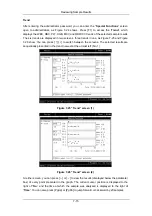
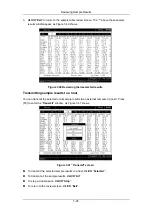
Figure 7-46 “Trend” screen (2)
At either screen, you can press [
←
] or [
→
] to view the results (displayed below the parameter
box) of every point presented in the graph. The current cursor position is displayed to the
right of
“
No.
”
and the time at which the sample was analyzed is displayed to the right of
“
Time
”. You can also press [PgUp] or [PgDn] to jump forward or backward by 20 samples.
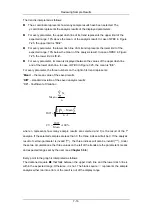
The trend is interpreted as follows:
The x-coordinate represents how many sample results have been selected. The
y-coordinate represents the analysis results of the displayed parameters.
For every parameter, the upper dash line of its trend represents the upper limit of the
expected range, 10% above the mean, of the analysis result. In case of WBC in Figure
7-45, the upper limit is “
10.2
”.
Содержание BC-2800
Страница 1: ...BC 2800 Auto Hematology Analyzer Operator s Manual ...
Страница 2: ......
Страница 12: ......
Страница 24: ...Using This Manual 1 12 Figure 1 4 High voltage warning label 7 High Voltage 7 ...
Страница 62: ......
Страница 91: ...Customizing the Analyzer Software 5 29 Figure 5 46 Saving changes ...
Страница 92: ......
Страница 122: ...Operating Your Analyzer 6 30 z Dispose of reagents waste samples consumables etc according to government regulations ...
Страница 170: ...Using the QC Programs 8 14 Figure 8 18 Transmission dialog box ...
Страница 196: ......
Страница 248: ......
Страница 252: ......
Страница 258: ...Appendices B 6 38 6 cm 32 2 cm 43 7 cm B 13 Weight Less than 23 kg B 14 Contraindications None ...
Страница 266: ......
Страница 284: ...Appendices E 10 Hemoglobin Concentration ...
Страница 286: ...P N 2800 20 28795 2 0 ...

